
 Home
Home News
News

- 1 OKTA stock price slumped 8% in the last 7 days and added 1.35% more on Tuesday to close at $82.04.
- 2 Okta Inc. (NYSE: OKTA) stock price suffered rejection from the upper supply zone and declined.
- 3 The daily chart shows volatility in the Okta Inc. price.
Okta Inc. (NYSE: OKTA) stock price slumped more than 8% in the last seven days and is nearing the exponential moving average of 200-day EMA. The EMAs may act as a support for the price and halt the decline.
The daily charts illustrate that the stock consolidated near positive trendline support ahead of the results. The company reported quarterly results on Wednesday, 30th August. The results outperformed the Wall Street estimates which positively impacted the precise trend.
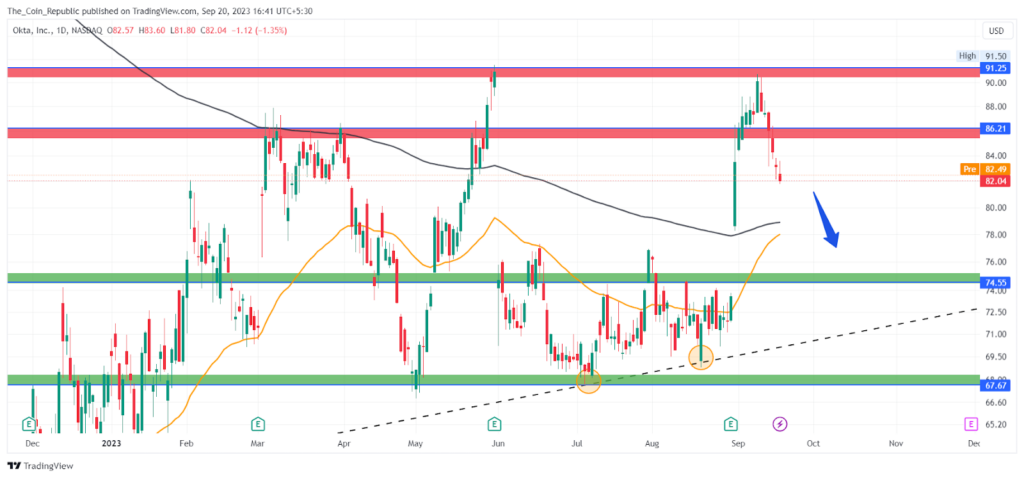
The quarterly results triggered a breakout which hiked the price to a high of $90. Thereafter, the stock consolidated and declined. The technical indicators imply that the price had shown a breakout of the 50-day and 200-day EMA and is currently nearing the EMAs which may act as a support for the price.

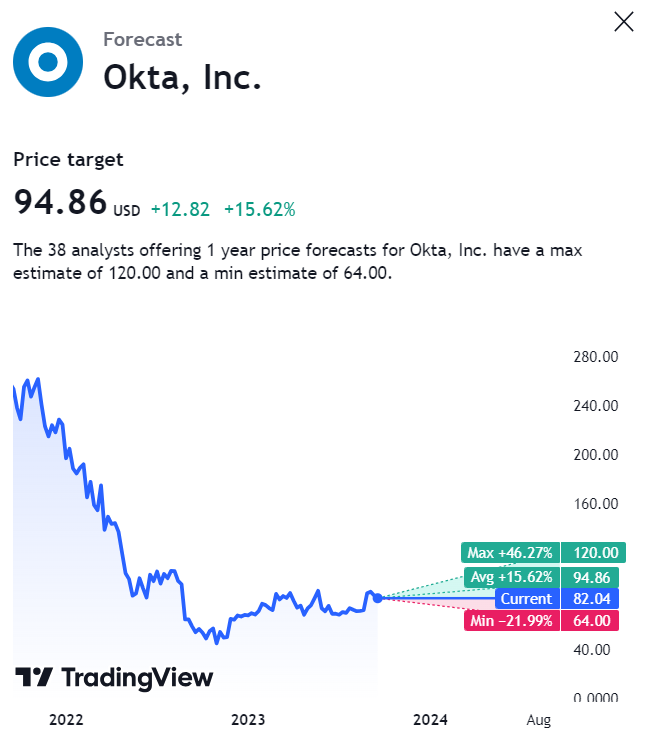
The analysts offering a 1-year price forecast for Okta Inc. have a wide range of outlooks. The analysts have a maximum bullish outlook of 46% which could take the price to a high of $120. Also, the analysts have a bearish outlook of 21.9% which could drag the price down to a low of $64.
OKTA stock option-chain analysis states that the current implied volatility in the market is 35.34% with an increment of 0.27% in the last trading session. The at-the-money strike price has 2603 open contracts on the PUT side and 64 open contracts on the CALL side indicating the dominance of buyers at the current level.
OKTA Stock Price Takes Pullback After Breakout
The OKTA stock price currently trades at $82.04. The price has suffered rejection from the upper supply zone and declining. The option chain data shows the dominance of buyers at the current level. The price trend illustrates that the stock has shown a breakout and currently declining for a pullback.
The price might get the buyer’s support near the 50-day and 200-day EMAs and surge higher. The stock also has a lower trendline support which may try to halt the decline if the price declines below the EMAs.
EMAs Show Bearishness in the Short-Term
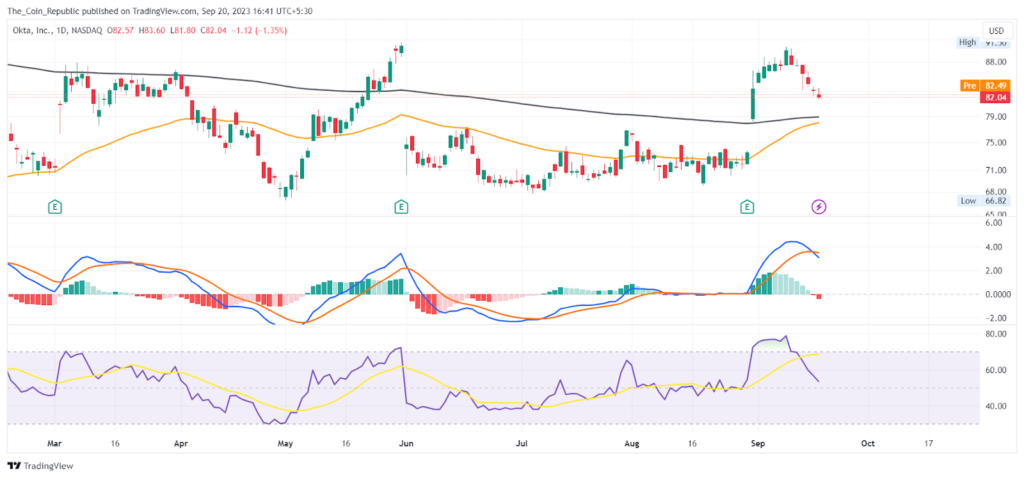
The daily OKTA stock price chart shows that the price showed a breakout of the EMAs indicating the optimistic trend in the stock. The overall technical opinion rating including RSI and MACD signals 88% “buy” with the average short-term outlook on maintaining the current direction.
Conclusion
Okta Inc. is a company that provides cloud-based identity solutions. The OKTA stock price is in an uptrend and broke out after the quarterly results. The price declined after reaching a high of $90 and is approaching the 50-day and 200-day EMAs. The EMAs may act as support and push the price higher. The analysts have a high estimate of $120 and a low estimate of $64 for the next year. The option data shows the buyers are dominant at the current level. The price trend is bullish with a possible pullback.
Technical Levels
- Support levels: $74.5 and $67.67
- Resistance levels: $86.21 and $91.25
Disclaimer
The views and opinions stated by the author, or any people named in this article, are for informational purposes only and do not establish financial, investment, or other advice. Investing in or trading crypto or stock comes with a risk of financial loss.

With a background in journalism, Ritika Sharma has worked with many reputed media firms focusing on general news such as politics and crime. She joined The Coin Republic as a reporter for crypto, and found a great passion for cryptocurrency, Web3, NFTs and other digital assets. She spends a lot of time researching and delving deeper into these concepts around the clock, and is a strong advocate for women in STEM.


