
 Home
Home News
News
- 1 The CRDA stock price: Following its peak during the pandemic, the stock price has been consistently decreasing. Know the reason below
- 2 Croda International Plc is keeping a good chunk of profit and is distributing to its shareholders
- 3 The bulls have reclaimed their position through the immediate support level
Croda International Plc (LON: CRDA) is a listed company on the London Stock Exchange. It specializes in producing and distributing high-quality chemicals. Their business is organized into segments like Consumer Care, Life Sciences, and Industrial Specialties.
Financial snapshot of Croda
In 2022, the firm reported a revenue of £2.1 Billion, which was around 10.5% more than the previous year. After the cost of goods sold, the firm kept a gross profit of £864 Million, with a margin of 41%. Later down the line, the firm kept a net profit of £649 Million which is 31% of the total revenue.

With a large chunk of net profit, major profitability ratios are optimal. The return on equity is 31%, Return on assets is 18%. Moreover, on the balance sheet side, the current ratio is 2.38. It is slowing a good availability of cash and equivalents
Apart from this, the management also puts the shareholders ahead by offering regular dividends. On average, the company pays a dividend per share of £0.91, which makes up a dividend yield of 1.5% on average.
Why the stock is falling despite the stable financials
The CRDA stock price has been falling since 2022 and valuation is one of the major reasons behind that fall. During the 2021 end, the price and earnings ratio on average was more than 40. Yet, the actual average ratio throughout the years is 23-254. This current drop is a correction in the CRDA stock.
Technical Analysis and Prediction of CRDA Stock Price
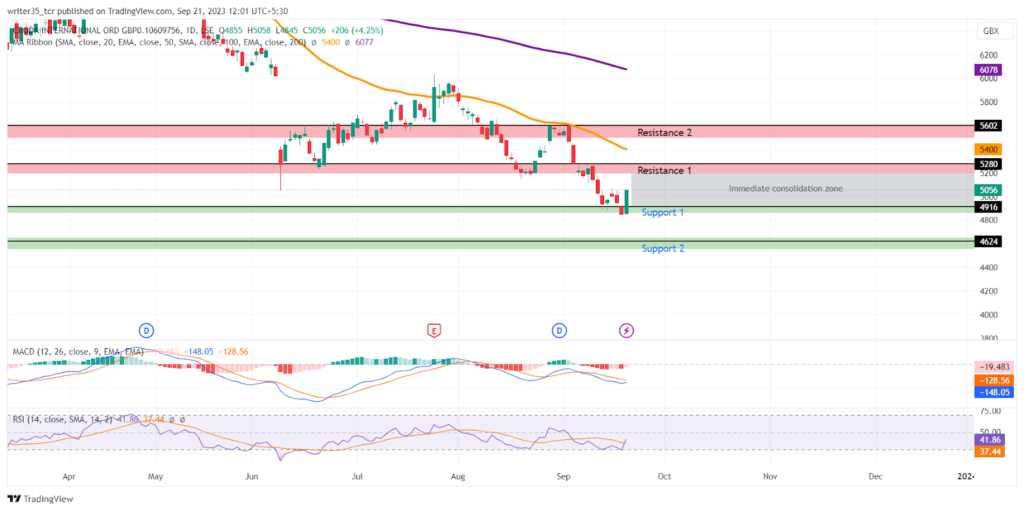
As of this writing, the stock is trading at a level of £5050 after reclaiming its support level of £4916. As the bulls are pushing forward, the immediate resistance for them would be at £5280. If a breakout occurs, the second resistance will be £5602, and on the downside, the second support will be at £4624
Apart from the pivot levels, the indicators can be traders’ wingmen. The RSI graph, for example, shows that, in the current scenario, the CRDA stock price is in its weak zone. The RSI line has made a rebound from its oversold level of 30. It is now at 41. Meanwhile, its Simple moving average (SMA) is likely to make a bullish crossover with it. If the CRDA stock price moves towards its resistance level, the RSI will get into its neutral zone of 50.
Conclusion
Croda International Plc (LON: CRDA) specializes in producing and distributing high-quality chemicals. The company is financially stable, but the CRDA stock price has fallen after 2021. The price prediction for the stock is bullish till it reaches its immediate resistance level.
Technical Levels
Support: £4916, £4624
Resistance: £5280, £5602
Disclaimer
The views and opinions stated by the author, or any people named in this article, are for informational purposes only. They do not establish financial, investment, or other advice. Investing in or trading crypto assets comes with a risk of financial loss.

With a background in journalism, Ritika Sharma has worked with many reputed media firms focusing on general news such as politics and crime. She joined The Coin Republic as a reporter for crypto, and found a great passion for cryptocurrency, Web3, NFTs and other digital assets. She spends a lot of time researching and delving deeper into these concepts around the clock, and is a strong advocate for women in STEM.


