
 Home
Home News
News
- 1 GALA crypto price decreased by 6.03% over the past seven days.
- 2 GALA crypto price is currently trading at $0.01332251 with a drop of 3.77% in the last 24 hours and a market cap of $323.457 Million.
The GALA crypto continues to exhibit weakness on the charts, with sellers exerting pressure in recent trading sessions. Furthermore, the chart structure favors the bears, and the price continues to form doji candles, which shows a fight between bears and bulls.
At the time of writing, the GALA crypto trades at $0.01332251 with an intraday drop of 3.77%, indicating bearishness. Buyers are making efforts to gain traction in the market, but they were only able to secure a few critical support levels. Intraday trading volume also increased by 48% to $56,614,725 Million. Moreover, GALAUSD crypto suggests further volatility in the following sessions.

The GALA crypto is in a downtrend on the daily charts and underperformed in the past months. Furthermore, the technical indicators continue to signal bearishness, with no signs of a bullish reversal as of now.
Technical Analysis of GALA Crypto Price in 1-D Timeframe
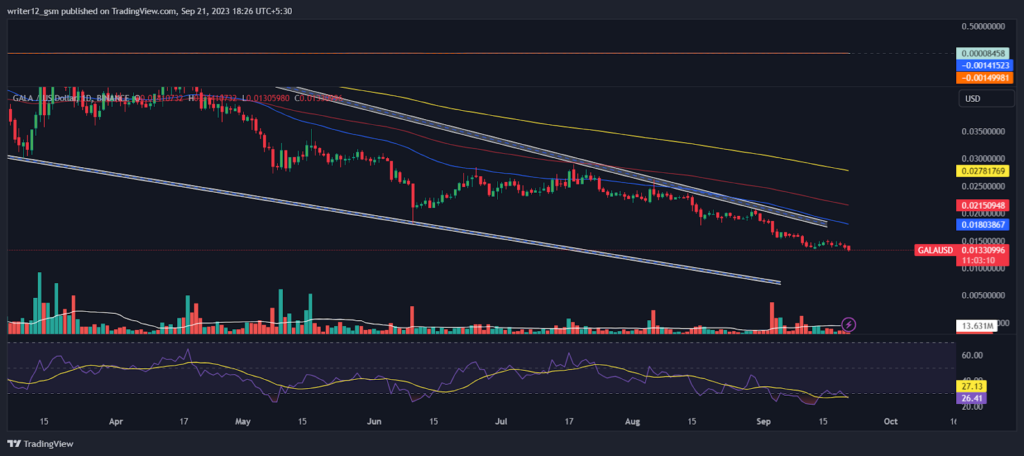
At the time of publishing, GALA crypto (USD: GALAUSD) is trading above the 50 and 200-day SMAs (simple moving averages), which are not supporting the price trend.
However, if selling volume adds up, then the price might conquer supporting SMAs by making lower highs and lows. Hence, the GALAUSD price is expected to move downwards giving bearish views over the daily time frame chart.
The current value of RSI is 27 points. The 14 SMA is below the median line at 27.22 points which indicates that the GALA crypto is bearish.
The MACD line at -0.00139358 and the signal line at -0.00149548 are below the zero line. A bearish crossover is observed in the MACD indicator which signals more bearishness for the GALAUSD crypto price.
On the 4-hour charts, the GALA price is currently under the sellers’ control, and buyers were unable to surpass the neutral range. The price action indicates that sellers are persistently pushing back against the bulls below the lower trajectory.
The relative strength index (RSI) curve is near the neutral range of 37, suggesting a negative outlook and bearishness on the charts.
The MACD is neutral, and both the moving averages converge, suggesting that a significant move can be shown in the upcoming sessions.
Summary
GALA crypto technical oscillators also support the bearish trend. The MACD, RSI, and EMAs are emphasizing negative signs and imply that the downtrend may continue in the GALAUSD crypto price. GALA Price action suggests that the investors and traders are bearish on the 1-D time frame. The price action reflects a bearish perspective at the moment.
Technical Levels
- Support Levels: $0.01246020 and $0.00406541.
- Resistance Levels: $0.01556628 and $0.02085499.
Disclaimer
This article is for informational purposes only and does not provide any financial, investment, or other advice. The author or any people mentioned in this article are not responsible for any financial loss that may occur from investing in or trading. Please do your own research before making any financial decisions
Steve Anderson is an Australian crypto enthusiast. He is a specialist in management and trading for over 5 years. Steve has worked as a crypto trader, he loves learning about decentralisation, understanding the true potential of the blockchain.


