
 Home
Home News
News

- 1 Sellers have gained momentum and looked aggressive in the past sessions.
- 2 OP stock shows selling pressure, and is heading toward the demand zone of $1.50.
OP stock price has been struggling to break above the key resistance level and has been stuck below it. Currently, OP shares need more buyers to support an upward movement toward recovery. However, the trading volume is low, which indicates a lack of interest and momentum. At the same time, OP shares have broken below the 50, 100, and 200-day daily moving averages, which are bearish signals.
OP stock price grew 1.83% last week; it grew by 1.21% in the month. Moreover, Oceanpal shares witnessed a decline of about 77.49% in the past six months and a plunge of 97.41% over the past year. Also, the Oceanpal share price has dropped by around 92.41% year to date. These trends collectively show the challenges faced by OP shares in their recovery efforts throughout the year.

Technical indicators highlight the downturn in OP stock price. Relative strength index (RSI) showcases and moving average convergence divergence (MACD) both indicate the slippage in OP share price.
The price at present requires substantial support from the buyers in order to make a recovery as it is facing major resistance from the previous resistance points and multiple moving average levels. Buyers are pulling the price action into their grasp, according to the candlestick patterns.
The price could soon make a bullish recovery. However, as it is trading below the key EMA levels, the buyers will have to face multiple resistance levels in order to attain the target. Buyers are presently making efforts to retake charge of the trend.
Technical Evaluation Of OP Stock
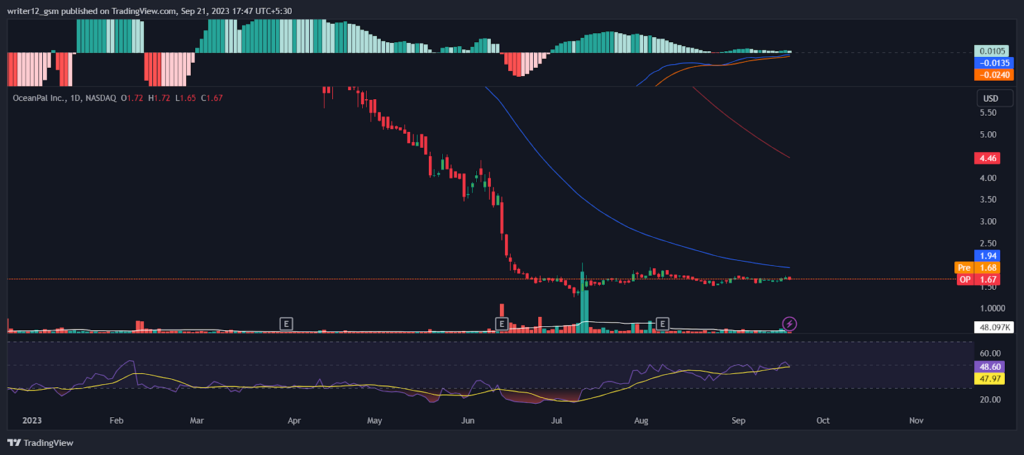
At the time of publishing, OP stock price is trading below the 50 and 200-day SMAs (simple moving averages), which do not support the price trend.
The current value of RSI is 48.60 points. The 14 SMA is above the median line at 47.97 points which indicates that the OP stock is bearish.
The MACD line at -0.0135 and the signal line at -0.0240 are below the zero line. A bullish crossover is observed in the MACD indicator which signals strength for the Oceanpal stock price.
On the daily charts, OP stock shows sellers’ dominance and slipped below neutrality, showing a negative outlook on the charts. Moreover, the price dropped below the 23.60% Fib level, near the lower Bollinger band.
Overall, the technical indicators and price action suggest that OP stock is bearish and that the downtrend could persist.
Summary
Technical oscillators are bearish on OP stock. The MACD, RSI, and EMAs are negative, suggesting that the downtrend will probably sustain. OP price action suggests that the investors and traders are bearish on the 1-D time frame. The price action reflects a bearish perspective at the moment.
Technical Levels
- Support Levels: $1.50 and $1.31.
- Resistance Levels: $1.73 and $1.92.
Disclaimer
This article is for informational purposes only and does not provide any financial, investment, or other advice. The author or any people mentioned in this article are not responsible for any financial loss that may occur from investing in or trading. Please do your own research before making any financial decisions.
Mr. Pratik chadhokar is an Indian Forex, Cryptocurrencies and Financial Market Advisor and analyst with a background in IT and Financial market Strategist. He specialises in market strategies and technical analysis and has spent over a year as a financial markets contributor and observer. He possesses strong technical analytical skills and is well known for his entertaining and informative analysis of the Financial markets.


