


SNAP stock price is facing strong bearish pressure – it is trading below the 100 and 200-day EMAs. The stock has failed to break above its key resistance levels near the EMAs in the past few months, despite several attempts by the buyers.
SNAP price prediction suggests that the stock is in the firm grip of the bears and needs to show signs of a reversal before confirming a bullish trend.
The technical indicators favor the bears projecting a pessimistic perspective for the buyers. RSI and stochastic RSI oscillators are moving near the overbought zone, whereas the major EMA lines are acting as barrier points for Snap Inc. price.
The company’s performance has been dismal throughout the year. It has suffered negative returns of -1.31% in the year-to-date period, -21.14% in the last six months, -2.27% in the last month, and -4.85% in the last week. This shows a persistent bearish trend that has not reversed yet.
Technical Analysis of SNAP Stock Price in 1-D Timeframe
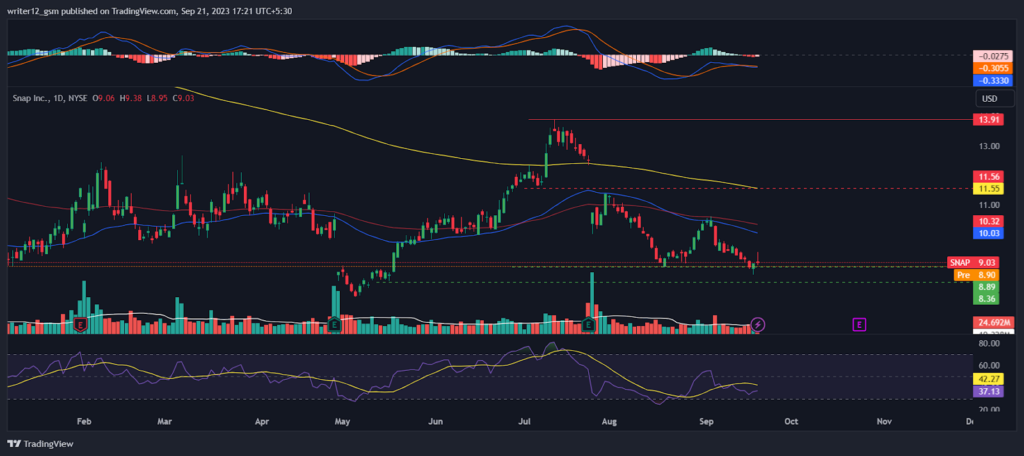
The stock is currently trading near $9.03, with a marginal gain of 0.33% in the intraday session. The stock has a potential upside target of $10.50, but it needs to overcome the bearish momentum and surge above the 200-day EMA. The stock has a support level of $8.89, which could prevent further downside.
SNAP stock is trading under the 50 and 200-day DMAs (daily moving averages), which do not uphold the price trend.
The current value of RSI is 37.13 points. The 14 SMA is below the median line at 42.27 points which indicates that SNAP stock is bearish.
The MACD line at -0.3330 and the signal line at -0.3055 are below the zero line. A bearish crossover is observed in the MACD which signals more bearishness for the Snap Inc. stock price.
Weekly-Time Horizon Analysis
The weekly charts of SNAP stock reveal that the sellers have been dominant. The stock has been on a downward trend, as it has broken below the key EMAs. The technical indicators also confirm the bearish sentiment, as the RSI is near the oversold zone at 38 while the MACD shows red bars and a bearish crossover. These signals indicate that the stock may face more downside pressure in the coming weeks.
Summary
SNAP stock technical oscillators are giving bearish signals. The MACD, RSI, and EMAs are emphasizing negative signs and imply that the downtrend is likely to continue in the Snap Inc. stock price. SNAP Price action suggests that the investors and traders are bearish on the 1-D time frame. The price action reflects a bearish perspective at the moment.
Technical Levels
- Support Levels: $8.03 and $7.71.
- Resistance Levels: $11.50 and $12.65.


