
 Home
Home News
News
- 1 Amazon stock price decreased by 10.86% over the past seven days, showcasing profit booking.
- 2 Amazon stock price is currently trading at $129.33 with a drop of 4.41% in the last 24 hours and a market cap of $1.327 Trillion.
Amazon stock price failed to sustain the high of $145.89 showing a reversal in direction, resuming the downtrend which indicates further weakness in the market. The market is trading below the dynamic support trendline and 100 EMA, which could lead to more downturn. However, the market is still in an uptrend on a larger time frame.
Amazon has been falling from its peak levels and taking support on 100 EMA. It is in a bearish trend after breaking below the 20-day and 50-day moving averages. The bearish pressure could push AMZN stock price to form a new lower low soon and extend the downtrend.
The current situation requires traders and investors to be patient and wait for a clear signal of a break above or below the range before making any moves. They should also avoid FOMO and minimize losses.
Amazon stock price dropped more than 10% last week; it also declined by 4.26% throughout the month. However, AMZN shares had a slight gain of about 0.17% in the past three months. The performance for the year is still impressive. The AMZN stock price has increased by approximately 51.33% year to date and gained 31.88% in the last six months, highlighting the recent weakness in the stock price.
Will Amazon Stock Break 100 EMA Support Level?

Currently, Amazon stock (NASDAQ: AMZN) is trading below the 50 and 200-day EMAs (exponential moving averages), which do not support the price trend. If bulls want to make a comeback, they will have to rise and sustain the price above the 20 and 50-day EMAs. However, the sellers seem to be more aggressive than the buyers.
The current value of RSI is 36.83 points. The 14 SMA is above the median line at 55.71 points which indicates that the Amazon stock price is bearish.
The MACD line at 0.4362 and the signal line at 1.46 are above the zero line. A bearish crossover is observed in the MACD which signals more bearishness for the AMZN stock price.
Analysts’ Take on AMZN Stock Price
Of the 53 analysts who rated AMZN stock, 44 rated ‘Strong Buy,’ while 6 give it a ‘Buy’ rating.
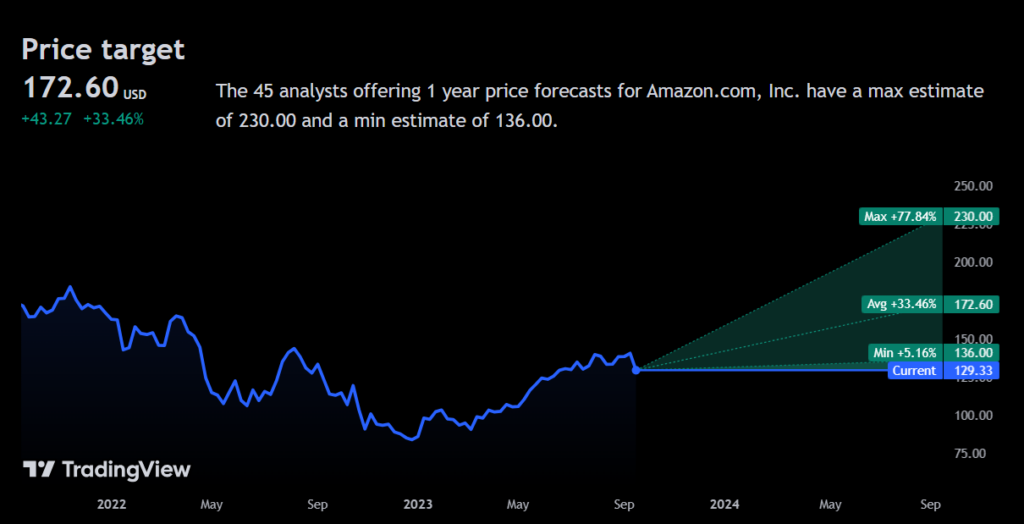
Amazon stock has an average price target of $172.60, which implies a potential increase of 33.46% from its current price of $129.33. The price targets vary from a high of $230 to a low of $136.00.
Summary
Amazon stock price prediction highlights bearishness in the chart. Sellers are dominating on the higher levels. Amazon (NASDAQ: AMZN) technical oscillators also support the bearish trend. The MACD, RSI, and EMA emphasize negative signs and imply that the downtrend may continue in the AMZN stock price till buyers start to support the price. AMZN stock price action suggests that the investors and traders are bearish on the 1-D time frame. Technical analysis suggests that the AMZN stock price is in a bearish grip and the probability of testing the previous lows in the coming months is high.
Technical Levels
- Support Levels: $118.80 and $101.58.
- Resistance Levels: $136.02 and $145.62.
Disclaimer
This article is for informational purposes only and does not provide any financial, investment, or other advice. The author or any people mentioned in this article are not responsible for any financial loss that may occur from investing in or trading. Please do your own research before making any financial decisions

Adarsh Singh is a true connoisseur of Defi and Blockchain technologies, who left his job at a “Big 4” multinational finance firm to pursue crypto and NFT trading full-time. He has a strong background in finance, with MBA from a prestigious B-school. He delves deep into these innovative fields, unraveling their intricacies. Uncovering hidden gems, be it coins, tokens or NFTs, is his expertise. NFTs drive deep interest for him, and his creative analysis of NFTs opens up engaging narratives. He strives to bring decentralized digital assets accessible to the masses.


