


 Price Recover?")

Archer-Daniels-Midland Company (ADM) stock’s market capitalization is $41.269 Billion and the shares float is $532.058 Million. Moreover, the stock’s basic EPS is $7.53 and the price-to-earnings ratio is 10.53.
Archer Daniels has a debt-to-equity ratio of 34.3%, as reported by Simply Wall St. This implies that it has less debt than equity, which is the difference between its total assets of $55.50 Billion and total liabilities of $30.22 Million. Archer Daniels’ debt is $8.67 Billion, while its equity is $25.28 Billion. The Archer Daniels stock publicized its earnings report for the September 2022 period ending on October 25th, 2022. The reported earnings gave a positive surprise of 30.33% from the estimated earnings.
Moreover, the reported revenue also gave a positive surprise from the estimate of 11.30%. Thereafter, on the charts, it is clearly noticeable that profit booking was so extreme that even in recent times, the stock has had a bearish effect and the price is still declining from the trendline.
Technical Analysis of ADM Stock Price in 1-D Timeframe
The price action shows that Archer-Daniels-Midland Company (NASDAQ: ADM) stock price took major rejection in November 2022 at $98 back in the year. It has been on a continued declining trend by making lower highs and lower lows ever since.
ADM stock is currently trading near $76.98, below the resistance level of $80 and a downward trendline. The chart shows that the stock failed to break above the trendline and after every earnings report, the stock has experienced profit-taking pressure.
Therefore, if the ADM price continues to decrease more with profit booking, it might hit the nearest support levels of $75 and $70.
However, if it maintains the current level and reverses, the ADM prices could continue to move upward and reach the first and second resistances of $80 and $85.
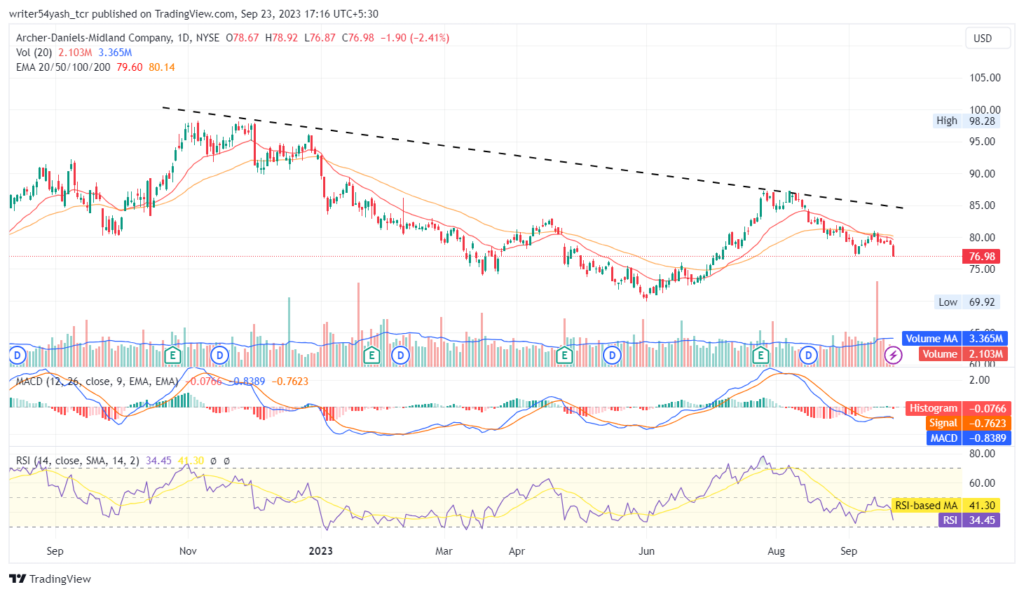
At the time of publishing, Archer-Daniels-Midland Company (NASDAQ: ADM) is trading below the major 20 and 50-day EMA (exponential moving averages), which rejects the ADM price trend.
The MACD line at 0.8389 and signal line at 0.7623 are above the zero line and both lines have crossed each other and a bearish crossover is observed.
The current value of RSI is 34.45 points. The 14 SMA is above the median line at 41.30 points which indicates that ADM stock is in bearish territory as RSI faced rejection from 14 SMA. Combiningly, all indicators indicate bearishness for the ADM stock.
Summary
Archer-Daniels-Midland Company (NASDAQ: ADM) chart indicates that the traders and investors of the stock price are bearish on the 1-D time frame. The price action shows a bearish outlook at the time of publishing and the profit booking might still continue. The technical analysis tools of Archer Daniel’s stock price indicates bearishness.
Technical Levels
- Support levels: $2 and $1.5
- Resistance levels: $3 and $3.5
Disclaimer
In this article, the views and opinions stated by the author, or any people named are for informational purposes only, and they don’t establish the investment, financial, or any other advice. Trading or investing in cryptocurrency assets comes with a risk of financial loss.


