
 Home
Home News
News
- 1 VET recently tried to break the 50 and 100 EMA curves but failed in the attempt.
- 2 VETUSD dropped 6.05% last week, losing the previous month’s gains.
The price action of the VeChain crypto showed that bearish pressure was noted on the daily charts and the price was in a downtrend, forming lower lows over the past few months. Moreover, due to declining investor interest, trading volume was below average.
The VeChain chart shows a decline in activity. The ongoing trend favors bears, and the crypto was also in a corrective phase, keeping buyers on toes. Moreover, VeChain price is below significant moving averages, it is inching closer to the 50-day EMA to hold the gains.
At the time of writing, the VeChain price was $0.01674705 with an intraday loss of 1.58%, suggesting bearishness. Moreover, the intraday trading volume is $7.061 Million while the market cap is $1.218 Billion.
VET crypto has performed poorly over the years. Year-to-date, it gave nominal returns of 5.51%, and negative returns of 26.07% in a span of 6 months. In the last 1 month, it gave a nominal return of 2.16% and a negative return of 6.05% in the last seven days. Indicating a long bearish trend.
Technical Analysis of VeChain Crypto Price in 1-D Timeframe
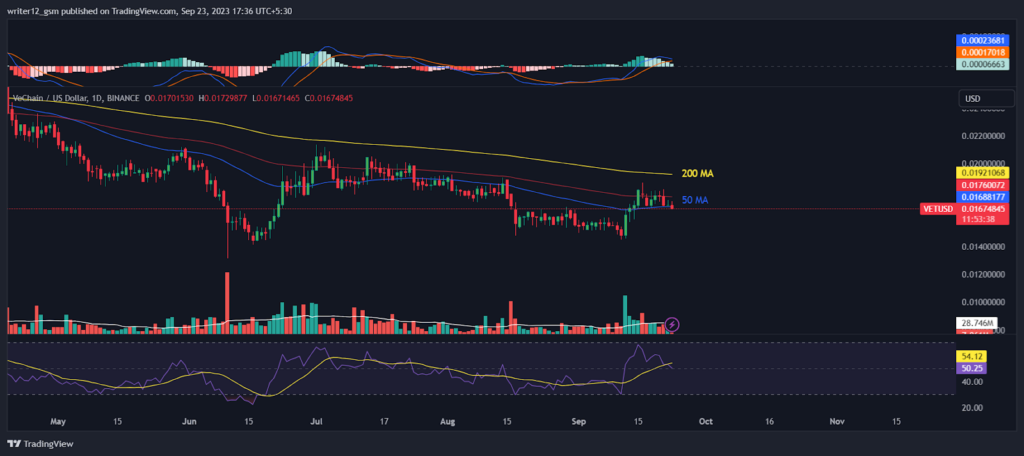
At the time of publishing, VeChain crypto (USD: VET) is trading above the 50 and 200-day SMAs (simple moving averages), which do not support the price trend.
The current value of RSI is 54.12 points. The 14 SMA is above the median line at 50.25 points which indicates that the VeChain crypto is bearish.
The MACD line at 0.00023681 and the signal line at 0.00017018 are above the zero line. A bearish crossover is observed in the MACD indicator which signals more bearishness for the VET crypto price.
Weekly Time Frame Technical Evaluation
VETUSD has shown sellers’ strength on the weekly charts. Moreover, the price traded below the key EMAs, which shows further weakness in the Vechain price. The RSI curve is near the oversold region at 38, and a negative outlook was noted, indicating bearishness in the stock. The MACD shows red bars; a bearish crossover was noted, which implies corrective moves.
Summary
VeChain crypto technical oscillators support the bearish trend. The MACD, RSI, and EMAs are emphasizing negative signs and imply that the downtrend will persist. VeChain price action suggests that the investors and traders are bearish on the 1-D time frame.
Technical Levels
- Support Levels: $0.01385661 and $0.01215291.
- Resistance Levels: $0.01822787 and $0.02089543.
Disclaimer
This article is for informational purposes only and does not provide any financial, investment, or other advice. The author or any people mentioned in this article are not responsible for any financial loss that may occur from investing in or trading. Please do your own research before making any financial decisions

With a background in journalism, Ritika Sharma has worked with many reputed media firms focusing on general news such as politics and crime. She joined The Coin Republic as a reporter for crypto, and found a great passion for cryptocurrency, Web3, NFTs and other digital assets. She spends a lot of time researching and delving deeper into these concepts around the clock, and is a strong advocate for women in STEM.


