
 Home
Home News
News

- 1 Cardano price prediction showcases the fall of ADA crypto through an interesting declining pattern.
- 2 Cardano ADA price is trading below 20, 50, 100 and 200-days daily moving averages.
- 3 Cardano cryptocurrency declined slightly by 0.30% year to date.
Cardano price prediction highlights the fall of ADA crypto through an interesting declining pattern over the daily time frame chart. Meanwhile, ADA crypto has been slipping through an interesting falling pattern since July 2023. Now is the time of Cardano ADA price to register its breakout as ADA is on the verge of the descending triangle pattern. However, ADA crypto has been caged inside the descending triangle pattern and was under full influence of sellers. Buyers need to come forward for the rescue of ADA crypto. ADA crypto is currently at a crucial make-or-break situation.

Cardano price was at $0.244220000 and gained around 0.40% of its market capitalization intraday. Trading volume is up by 49.59% intraday, which demonstrates that buyers are trying to push ADA crypto price upwards over the daily time frame chart.

Will Cardano Price Register its Breakout?
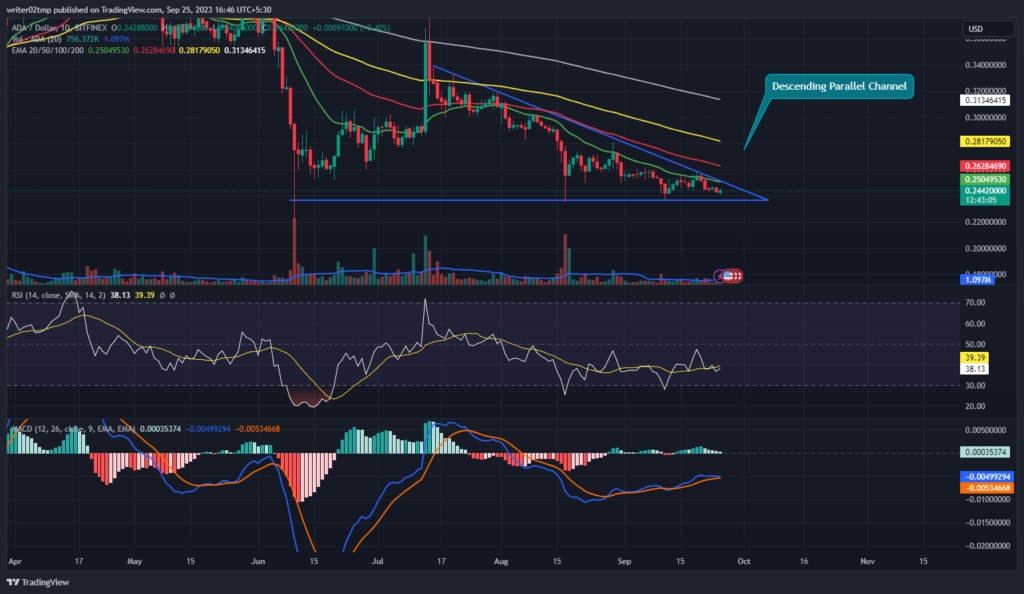
Cardano price prediction highlights the crucial make-or-break situation of ADA crypto inside the descending triangle pattern. Cardano crypto needs to attract buyers in order to surge towards the upper trendline of the consolidation phase over the daily time frame chart. However, volume change is below average and needs to grow intraday. Meanwhile, Cardano ADA price is below the 20, 50, 100 and 200-days daily moving averages.
Cardano price declined by 0.76% in a week and 6.08% in a month. Moreover, ADA crypto slipped around 12.59% in the last three months and 33.40% in the last six months. In addition, Cardano ADA price declined around 0.30% year to date. This suggests that ADA crypto may surge from the current declining pattern to initiate its recovery phase over the daily time frame chart and recover maximum in 2023.
Technical indicators suggest highlight the consolidation phase of Cardano ADA price. Relative strength index (RSI) and moving average convergence divergence (MACD) confirm the struggle of ADA inside the descending triangle pattern.
RSI was at 37 and is heading towards neutrality. The MACD line is trying to sustain above the signal line but with a minor difference. Investors in Cardano cryptocurrency need to wait until ADA crypto approaches the upper trendline of the descending triangle pattern.
Summary
Cardano price prediction highlights the fall of ADA crypto through an interesting declining pattern over the daily time frame chart. However, volume change is below average and needs to grow intraday. In addition, Cardano ADA price declined around 0.30% year to date. Technical indicators suggest the consolidation phase of Cardano ADA price. Investors in Cardano cryptocurrency need to wait until ADA crypto approaches the upper trendline of the descending triangle pattern.
Technical Levels
Support Levels: $0.23666424 and $0.23000000
Resistance Levels: $0.24729675 and $0.25565086
Disclaimer
The views and opinions stated by the author, or any people named in this article, are for informational purposes only, and they do not establish financial, investment, or other advice. Investing in or trading crypto or stock comes with a risk of financial loss.
Mr. Pratik chadhokar is an Indian Forex, Cryptocurrencies and Financial Market Advisor and analyst with a background in IT and Financial market Strategist. He specialises in market strategies and technical analysis and has spent over a year as a financial markets contributor and observer. He possesses strong technical analytical skills and is well known for his entertaining and informative analysis of the Financial markets.


