
 Home
Home News
News

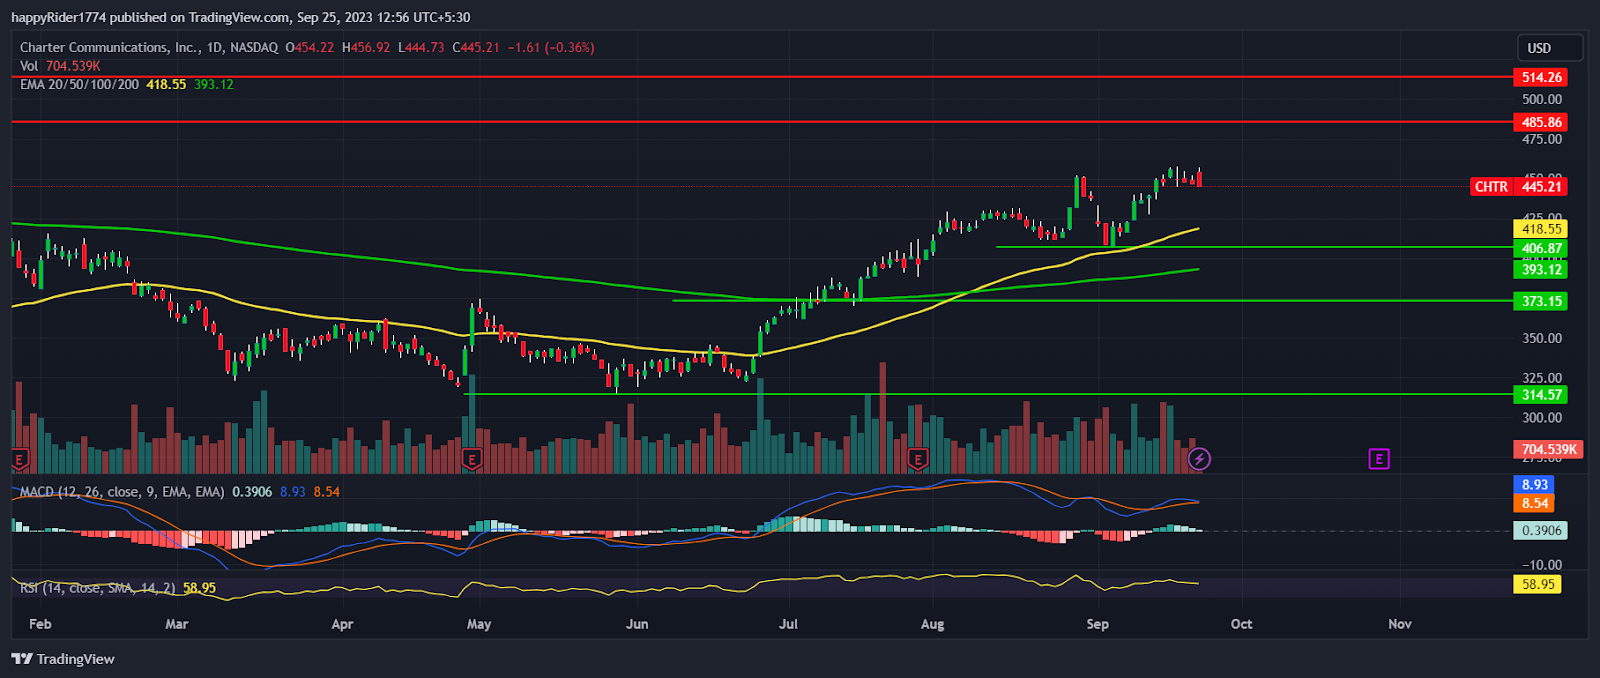
- 1 Charter stock price is trading near the year-to-date high.
- 2 CHTR stock price is in an uptrend and is trading above both the EMAs.
- 3 Charter Communications stock price is attempting to break past the $450 hurdle.
Charter Communication Inc. (NASDAQ: CHTR) stock price rose by 30.34% on a YTD basis and formed a bullish pattern. It continues to rise upward by forming higher high swings which is boosting the confidence of long-term investors.
Charter stock price is trading above the 50 day and 200 day EMAs. This demonstrates that the stock is in a strong uptrend and that bulls are continuing their dominance.

Recently, the 50 day EMA positively intersected with the 200 day EMA, which resulted in a golden crossover. This grabbed the attention of the investors which fueled a further rally in the stock.
In the beginning of September, CHTR stock price witnessed minor profit booking from the higher level. However, the stock price did not fall much and took support near $406.00.
Later, Charter stock price bounced back with strong momentum and hit the 52-week high. The price looks mildly overstretched so a minor retracement to the 50 day EMA is possible. This retracement might lead to a period of narrow range consolidation in the market.
Charter Communication stock price closed the previous session at $445.21 with an intraday decline of -0.36%. The market capitalization stands at $66.63 Billion.
CHTR Stock: Which Will Come First, $400 or $500?
CHTR stock price is in a bullish grip and any short-term bounce is likely to get absorbed by the buyers. The price pattern is bullish and $400.00 has now turned out to be a strong support for the bulls.
As long as Charter stock price sustains above the 50 day EMA, the probability of continuing the upward momentum will remain high.
However, on the higher side $485.00 will act as a strong hurdle for the bulls. If buyers succeed in breaking past the $485.00 hurdle, then the possibility of reaching $500.00 will increase.
On the other hand, if the CHTR stock price drops below the 50 day EMA, then it may test $400.00.
Charter Stock Price Bullish on a Multiple Time Frames
Charter stock price is forming a bullish pattern on a daily, weekly, and monthly time frame. The buyers look more active as compared to the sellers. Thus, investors should look to buy whenever the price retraces down to the EMAs.
The MACD curve sustaining above the zero line indicates bullishness. However, it slopes sideways denoting that the price might consolidate for some time before deciding on the direction ahead. The RSI at 58 denotes the strength of the bulls and more room for an upside is open.
Conclusion
CHTR stock price rose by 30.34% on YTD basis. It formed a bullish pattern and prices seem to be in a strong uptrend.
The analysis suggests that Charter stock price is in a bullish grip and the possibility of reaching $500.00 remains high.
Technical levels
- Resistance levels: $485.00 and $514.00
- Support levels: $400.00 and $373.00
Disclaimer
The views and opinions stated by the author, or any people named in this article, are for informational purposes only. They do not establish financial, investment, or other advice. Investing in or trading crypto assets comes with a risk of financial loss.

Nancy J. Allen is a crypto enthusiast, with a major in macroeconomics and minor in business statistics. She believes that cryptocurrencies inspire people to be their own banks, and step aside from traditional monetary exchange systems. She is also intrigued by blockchain technology and its functioning. She frequently researches, and posts content on the top altcoins, their theoretical working principles and technical price predictions.


