
 Home
Home News
News
- 1 The year-to-date return of Schlumberger Group stock is 11.69% while the three-month return is 27.96%.
- 2 Schlumberger stock price is between the major 20-day and 50-day daily moving averages.
- 3 Schlumberger NV. (NYSE: SLB) stock’s 52-week price range is around $30 – $62.
Schlumberger NV is a technology provider for the oil and gas industry that offers solutions for reservoir characterization, drilling, production, and processing. The company’s founders are Conrad Schlumberger and Marcel Schlumberger, who established it in 1926. The company’s headquarters are situated in Houston, TX.
At press time, Schlumberger stock has a CMP of $59.04 and an intraday gain of 0.37%. The stock’s average volume for the last 10 days is 8.152 million and its current volume is 5.979 million.

The SLB stock has a float of 1.418 Billion shares and a market cap of $83.907 Billion. The Schlumberger stock’s earnings per share (EPS) for the trailing twelve months (TTM) is 2.77 and its price-to-earnings ratio (P/E) for the same period is 21.54.
The SLB stock’s dividend yield for the TTM is 1.44% and its last dividend payment was $0.25 per share. The last ex-dividend date was September 5th, 2023 and its payout ratio is 31.12%.
The SLB stock’s latest quarterly report for the period ending June 2023 showed a revenue of $8.10 Billion, a net income of $1.03 Billion, and a profit margin of 12.76%. Next quarter’s revenue is estimated to be 8.342 Billion.
The Schlumberger stock’s most recent quarterly balance sheet for the period ending June 2023 showed total assets of $44.83 Billion and total liabilities of $25.89 billion.
Based on recent data, the SLB stock reported an EPS of $0.72 for the second quarter, beating the analysts’ estimate of $0.708 by 1.72%. The next quarter’s EPS is estimated to be $0.775.
Schlumberger Group will announce its financial results for the third quarter of 2023 on Friday, October 20th, 2023, before the market opens.
SLB Stock Price Technical Analysis in 1-D Timeframe
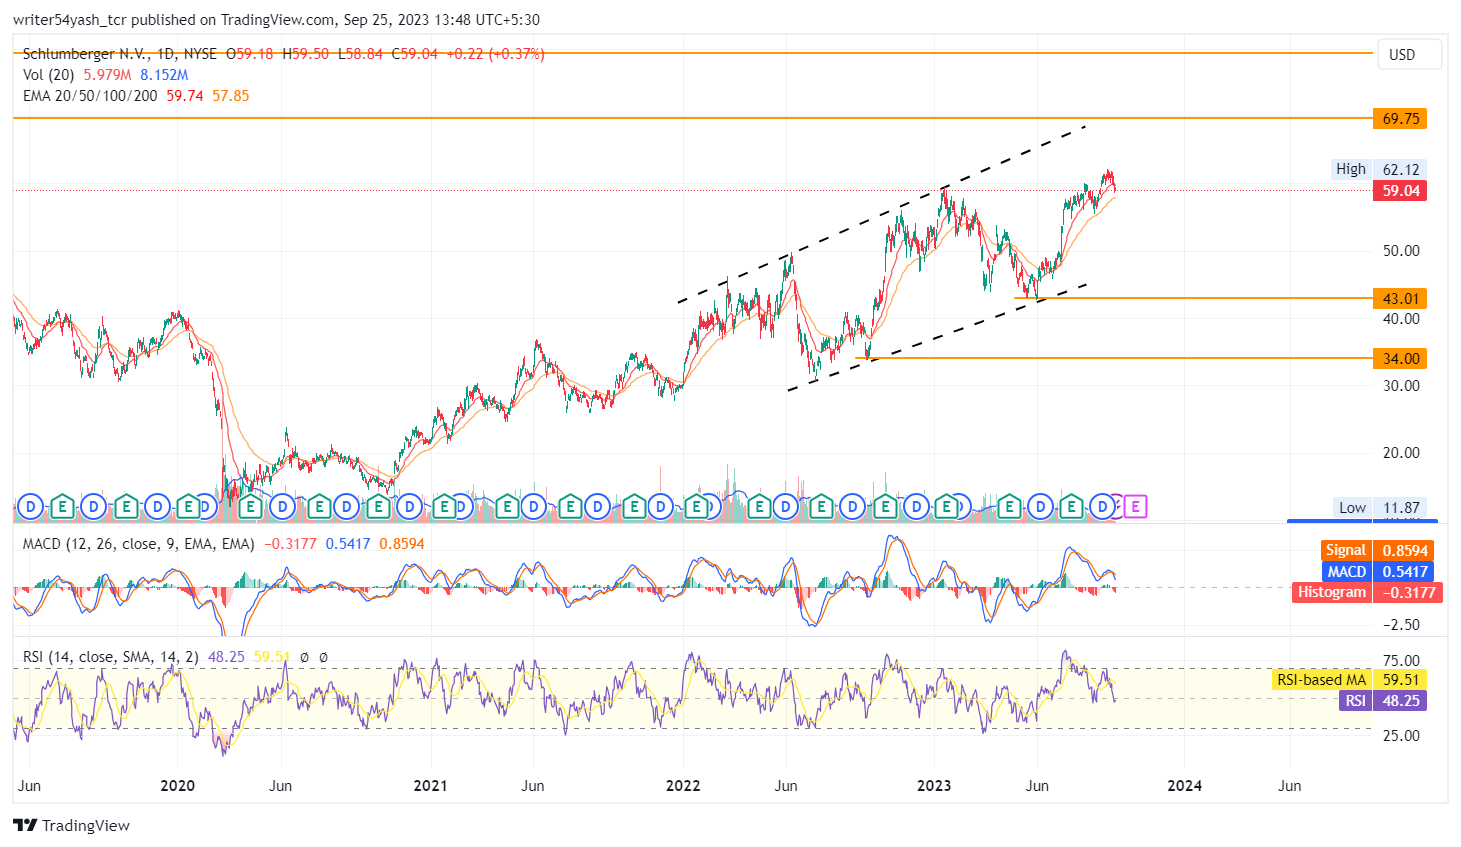
The Schlumberger stock has shown a remarkable performance in its share price over the past years, with a major bullish run that started in March 2020 from $11 and progressing slowly upwards with the help of trendline support and moving in an upward channel.
SLB stock has tested the upper trendline resistance three times but failed to break it. For the last three years it has been ascending, displaying a positive performance – year-to-date growth of 11.69% and a modest six-month increase of 33.54%.
Major moving averages are highlighting the price which is between the 20-day and 50-day MAs at press time. The MACD is highlighting a bearish cross and RSI is also taking resistance at 54.
The stock ratings for Schlumberger stock are positive and it is highly recommended by 26 analysts who have evaluated it in the last three months. The 1-year price forecasts for Schlumberger stock by 26 analysts range from $60 to $77, with a high potential for growth.
Summary
Schlumberger NV. (NYSE: SLB) chart indicates that the traders and investors of the SLB stock price are bullish on the 1-D time frame. The price action shows a bullish outlook at the time of publishing. The technical analysis tools of Schlumberger stock price also support bullishness. The EMAs, RSI, and MACD are giving mixed signals for Schlumberger stock price.
Technical Levels
Support levels: $43 and $34
Resistance levels: $69 and $79
Disclaimer
In this article, the views and opinions stated by the author, or any people named are for informational purposes only, and they don’t establish the investment, financial, or any other advice. Trading or investing in cryptocurrency assets comes with a risk of financial loss.

Nancy J. Allen is a crypto enthusiast, with a major in macroeconomics and minor in business statistics. She believes that cryptocurrencies inspire people to be their own banks, and step aside from traditional monetary exchange systems. She is also intrigued by blockchain technology and its functioning. She frequently researches, and posts content on the top altcoins, their theoretical working principles and technical price predictions.


