
 Home
Home News
News
- 1 Tesla stock price shows negative momentum as it dropped by 4.23% in the last trading session.
- 2 TSLA stock price broke key moving averages.
Tesla stock price shows signs of weakness, losing the gains it made below the key moving averages. TSLA stock price halted near the value of $299 as the price was pushed down by the bears. The buyers failed to maintain the momentum and started exiting positions, resulting in a decline in the stock price.
Tesla stock has been in a downtrend for the past months, forming lower highs and lower lows patterns, and facing resistance from the upper trendline, which prevented it from breaking out of the trend. The price action indicates that Tesla stock is under selling pressure, and that buyers have been passive. On the other hand, the sellers have a strong advantage and continue to make short positions.

At press time, TSLA stock was trading at $244.88 with an intraday loss of 4.23%, breaking below the 50-day EMA, showing bearishness on the charts. Moreover, the intraday trading volume is 127.524 and the average 10-day volume is 123.898 Million. The market cap of TSLA stock is $777.248 Billion.
Over the span of a week, TSLA stock has experienced a decrease of approximately 11.77%, and in the course of a month, it gained around 2.61%. Over a three-month period, TSLA shares dropped by about 5.56%, while the stock gave a positive return of around 25.96% over the last six months. Furthermore, the stock’s performance in recent times has been lackluster. Meanwhile, year-to-date it gave a positive return of $106.70%.
Technical Analysis of Tesla Stock Price in 1-D Time Frame
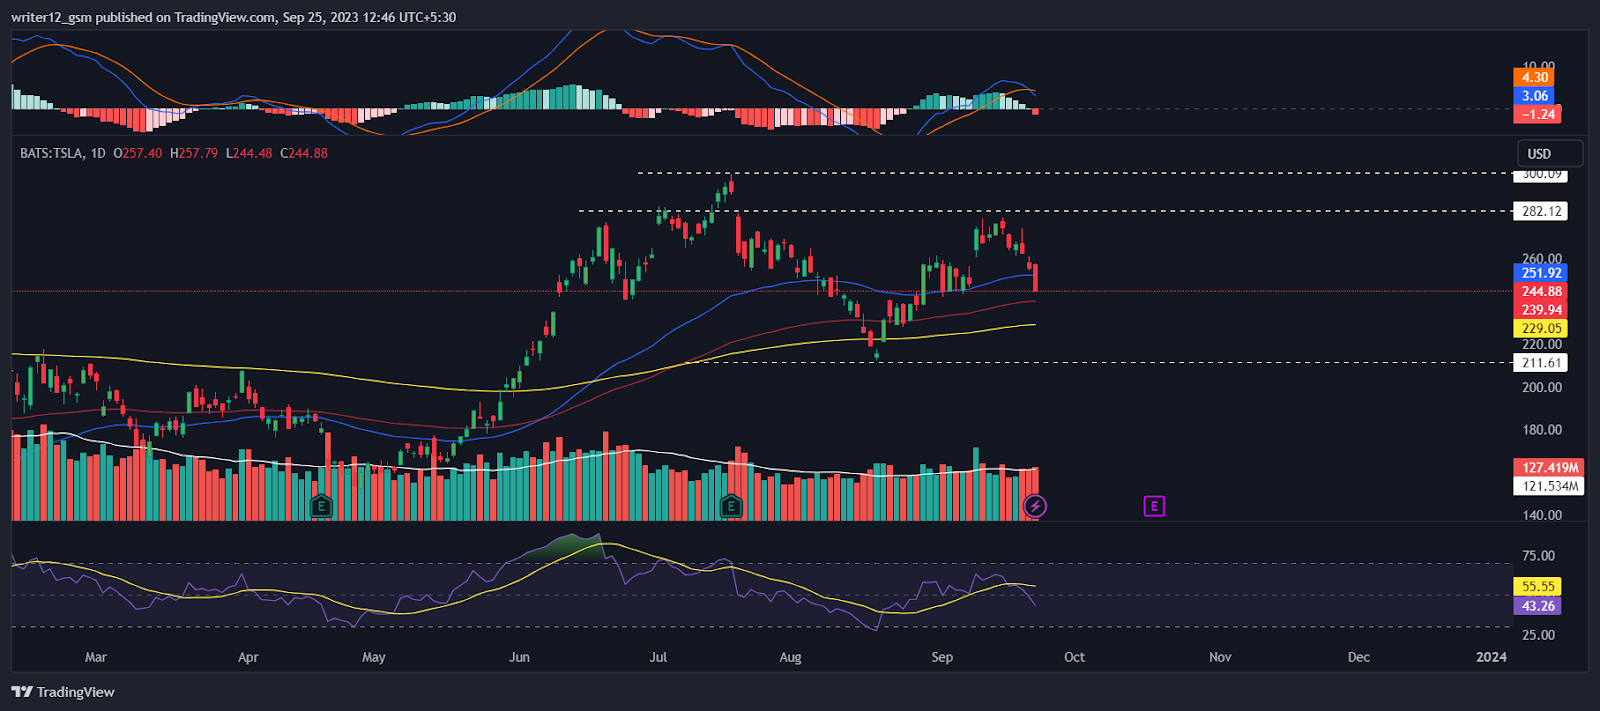
Tesla stock is currently below the 20-day and 50-day EMAs, which are not providing support to the price trend. However, if selling pressure increases, the price could break below these 100 and 200 EMAs and move lower.
The RSI indicator is currently at 43.26, which is in the neutral zone. However, the 14-day SMA is above the RSI curve, which is a bearish signal.
The MACD is also bearish – the MACD line crossed below the signal line which indicates that the Tesla stock is likely to continue to fall in the coming sessions.
Overall, the technical indicators suggest that Tesla stock price is bearish in the short term. However, if it can maintain the $240 level, it could continue to rise in the long term.
Summary
Tesla (NASDAQ: TSLA) technical oscillators support the bearish trend. The MACD, RSI, and EMAs are emphasizing negative signs and imply that the downtrend may continue in the TSLA stock price. Tesla price action suggests that the investors and traders are bearish on the 1-D time frame. The price action reflects a bearish perspective at the moment.
Technical Levels
- Support Levels: $239.00 and $229.00.
- Resistance Levels: $280.00 and $300.00.
Disclaimer
This article is for informational purposes only and does not provide any financial, investment, or other advice. The author or any people mentioned in this article are not responsible for any financial loss that may occur from investing in or trading. Please do your own research before making any financial decisions.

With a background in journalism, Ritika Sharma has worked with many reputed media firms focusing on general news such as politics and crime. She joined The Coin Republic as a reporter for crypto, and found a great passion for cryptocurrency, Web3, NFTs and other digital assets. She spends a lot of time researching and delving deeper into these concepts around the clock, and is a strong advocate for women in STEM.


