
 Home
Home News
News

- 1 JPM stock chart shows selling pressure and is heading toward the demand zone of $140.
- 2 Stock has broken below 20,50 and 100 day EMAs.
JPM stock price has been struggling to break above the $159.00 resistance level and is stuck below it. Currently, JPM shares need more buyers to support an upward movement toward recovery. However, the trading volume is low, which indicates a lack of interest and momentum. At the same time, JPM shares have broken below the 20, 50, and 100-day daily moving averages, which are bearish signals.

JPM stock price lost 3.06% last week. It fell by 1.60% in a month. However, JP Morgan shares witnessed a rise of about 11.53% in the past six months and a spike of 34.19% over the past year.

Also, the JP Morgan share price has dropped by around 7.17% year to date. These trends collectively show the challenges faced by JPM shares in their recovery efforts throughout the year. Technical indicators highlight the downtrend in the JPM stock price chart. Relative strength index (RSI) showcases and moving average convergence divergence (MACD) both indicate the slippage of JPM share price.
The price at present requires substantial support from the buyers in order to make a recovery as it is facing major resistance from the previous resistance points and multiple moving average levels. Buyers are pulling the price action into their grasp, according to the candlestick patterns.
The price may soon attempt to make a bullish recovery. However, as it is trading below the key EMA levels, the buyers will have to face multiple resistance levels in order to attain the target. Buyers are presently making efforts to retake charge of the trend.
On the daily charts, JPM stock shows sellers’ dominance as it slipped below neutrality, showing a negative outlook on the charts. Moreover, the price dropped below the 23.60% Fib level, heading toward the 50.00% Fib level, near the lower Bollinger band. Overall, the technical indicators and price action suggest that JPM stock is bearish and that the downtrend may continue.
Technical Evaluation of JPM Stock
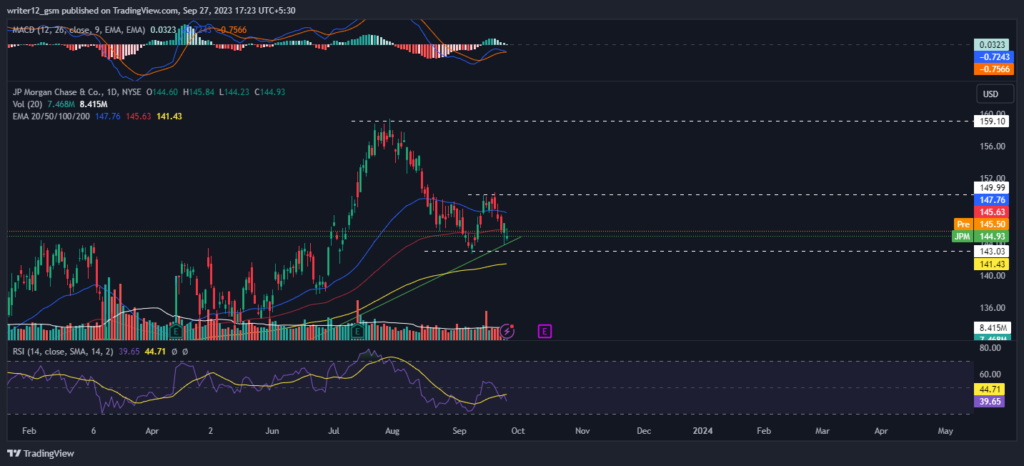
At the time of publishing, JPM stock price is below the 50 and 100-day SMAs (simple moving averages), which supported the price trend. The current value of RSI is 39.65 points. The 14 SMA is above the median line at 44.71 points which indicates that the JPM stock is bearish.
The MACD line at -0.7243 and the signal line at -0.7566 are below the zero line. A bearish crossover is observed in the MACD which signals more bearishness for the JP Morgan stock price.
Summary
JPM stock technical oscillators also support the bearish trend. The MACD, RSI, and EMAs are emphasizing negative signs and imply that the downtrend may continue in the JP Morgan stock price. JPM price action suggests that the investors and traders are bearish on the 1-D time frame. The price action reflects a bearish perspective at the moment.
Technical Levels
- Support Levels: $143.03 and $135.00
- Resistance Levels: $159.10 and $150.00
Disclaimer
This article is for informational purposes only and does not provide any financial, investment, or other advice. The author or any people mentioned in this article are not responsible for any financial loss that may occur from investing in or trading. Please do your own research before making any financial decisions.

Adarsh Singh is a true connoisseur of Defi and Blockchain technologies, who left his job at a “Big 4” multinational finance firm to pursue crypto and NFT trading full-time. He has a strong background in finance, with MBA from a prestigious B-school. He delves deep into these innovative fields, unraveling their intricacies. Uncovering hidden gems, be it coins, tokens or NFTs, is his expertise. NFTs drive deep interest for him, and his creative analysis of NFTs opens up engaging narratives. He strives to bring decentralized digital assets accessible to the masses.


