
 Home
Home News
News
- 1 K stock price has lost the initial gains and is below the 20-day EMA.
- 2 Buyers are unwinding their long positions because of the uncertainty.
Kellogg Company (K stock) price showed a panic sell-off and collapsed below the 20-day EMA, indicating that the bears started making short buildups, leading to a fall. K stock price is heading toward the primary support zone of $50. After the breakdown of the neckline of $65, sellers gained momentum. They continued to push K stock below the significant moving averages, creating trouble for the bulls and K share price.
K stock options chain delivers that massive call writing was witnessed at the strike price of $60 with the open interest of 1.21 Lakh shares, which acts as a resistance for the short term. Conversely, at the strike price of $55, a decent put writing of 2.80 Lakh shares was noted, which acts as a support zone. On the other hand, sellers persisted in adding short positions as the buyers exit their long positions.

At press time, K stock price was trading $59.18 with an intraday drop of 0.52%, showing adverse price action in the last session. Moreover, the trading volume is up by 0.24% to 2.78 Million, and the market cap is $20.26 Billion. However, analysts maintained a neutral rating with a yearly target price of $70.30, suggesting volatility in the coming sessions.
Kellogg Co. engages in the manufacturing, marketing, and distribution of ready-to-eat cereal and convenience foods. It operates through the following segments: North America, Europe, Latin America, Asia, the Middle East, and Africa. The North American segment includes the U.S. businesses and Canada. The Europe segment consists of European countries. The Latin America segment focuses on Central and South America and Mexico.
Will K Stock Rebound to $65?
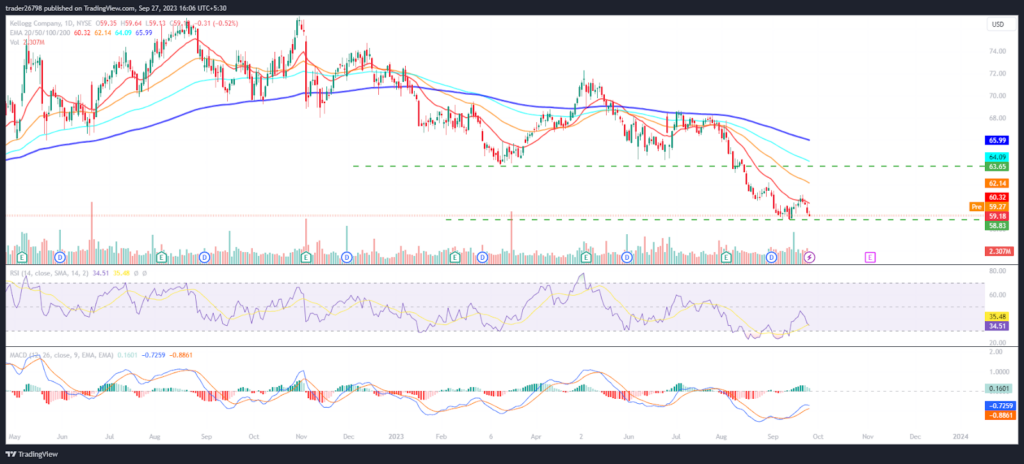
On the daily charts, K stock is on the bearish track. It lost the initial momentum by decisively splitting the support zones in the past sessions. Moreover, the K stock price has slipped below the 20-day EMA and is heading toward the round spot of $50, which, if retested, would push the bulls to protect the region by hook or crook.
The RSI curve is below neutrality and showed a bearish divergence, highlighting the past sessions’ selling pressure. The MACD shows a bullish crossover and green bars on the histogram.
Summary
Kellogg Company (K stock) price is at a make-or-break level, which, if sustained, would lead to a bounce to retest the neckline of $65. Conversely, if it breaks decisively, it would be another sign of bearishness and may head to the $50 level in the upcoming sessions. K stock signals bearish dominance and suggests that volatility may continue in the upcoming sessions.
Technical Levels
Support Levels: $55 and $50
Resistance Levels: $65 and $70
Disclaimer
The views and opinions stated by the author or any other person named in this article are for informational purposes only and do not constitute financial, investment, or other advice. Investing in or trading crypto or stocks comes with a risk of financial loss.

With a background in journalism, Ritika Sharma has worked with many reputed media firms focusing on general news such as politics and crime. She joined The Coin Republic as a reporter for crypto, and found a great passion for cryptocurrency, Web3, NFTs and other digital assets. She spends a lot of time researching and delving deeper into these concepts around the clock, and is a strong advocate for women in STEM.


