
 Home
Home News
News
- 1 Visa Inc.’s stock price slid 1.59% in the last trading session and closed at $229.65.
- 2 Visa’s share (NYSE: V) price has been on a losing streak of six consecutive days wiping out almost 7% of its value.
- 3 Visa share price declined to close near the 200-day EMA.
Visa Inc. stock price has witnessed a free fall for the past six sessions. The stock price was in a continuous decline and witnessed the largest losing streak in September 2022, when it fell for eleven consecutive sessions.

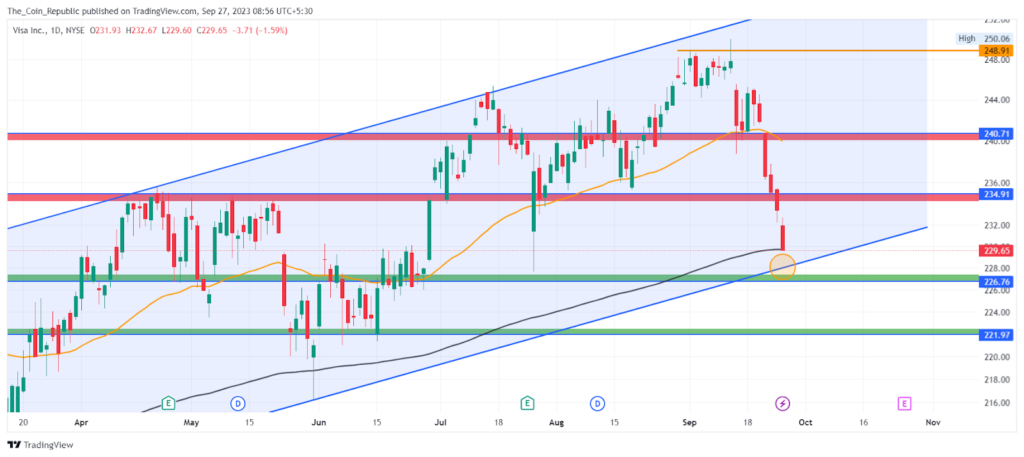
The price action analysis illustrates that the stock seems to form a double-top pattern forming an all-time high. The stock had a previous all-time of $252 formed in July 2021. The Bulls were dominating the trend and took the price to $250. Thereafter, they lost momentum and the stock failed to gain further.

The daily chart shows that the V stock was maintaining an optimistic trend for the last two quarters and surged higher taking support from the 50-day and 200-day EMA. Although the stock was volatile over the charts, it maintained the inclining trend till the $250 level.
The consecutive decline has shifted the short-term trend in the favor of bears. The stock price has a key defending zone of 200-EMA that might be the last hope for the bulls to turn the short-term trend in their favor.
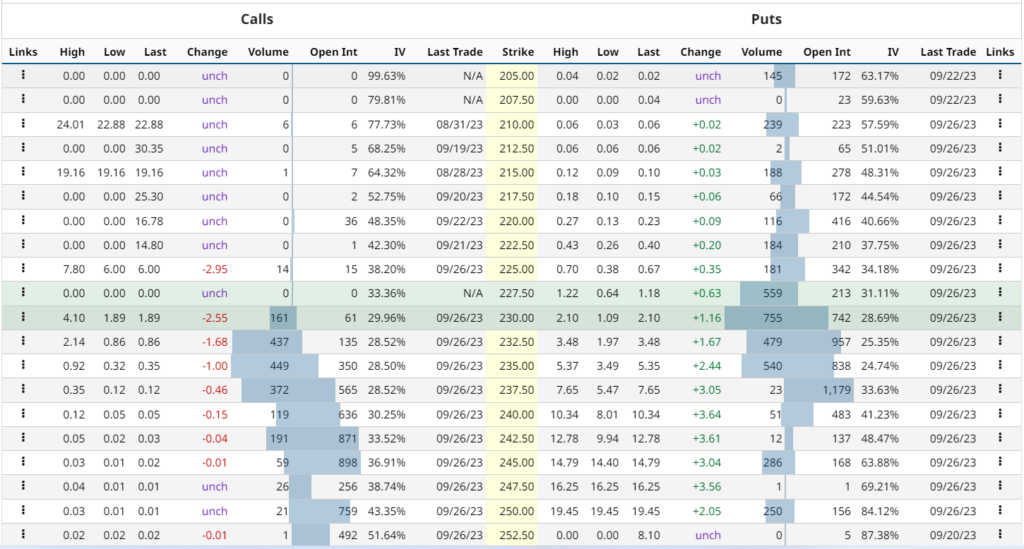
Visa stock derivatives data analysis states that the current implied volatility in the market is 24.59% with an increment of 2.01% in the last trading session. The at-the-money strike price has 742 open contracts on the put side and 61 open contracts on the call side indicating the dominance of buyers at the current level.
Visa Stock Price Might Take Support Near $225 Level
Visa stock currently trades at $229.65 with a decline of 7% in last 6 sessions. The V share price has a short-term trend as tilted to the bearish side. However, the long-term trend still favors the bulls.
The bulls need to accumulate at the lows and halt the bearish momentum to turn the trend in their favor. The Analysts offering a 1-year price forecast for Visa Inc. have a major bullish outlook with a maximum potential of 46% on the upside that could take the price to a high of $336. The analysts have a 4% bearish outlook.
Technical Indicators Signal A Bearish Outlook In The Short-Term
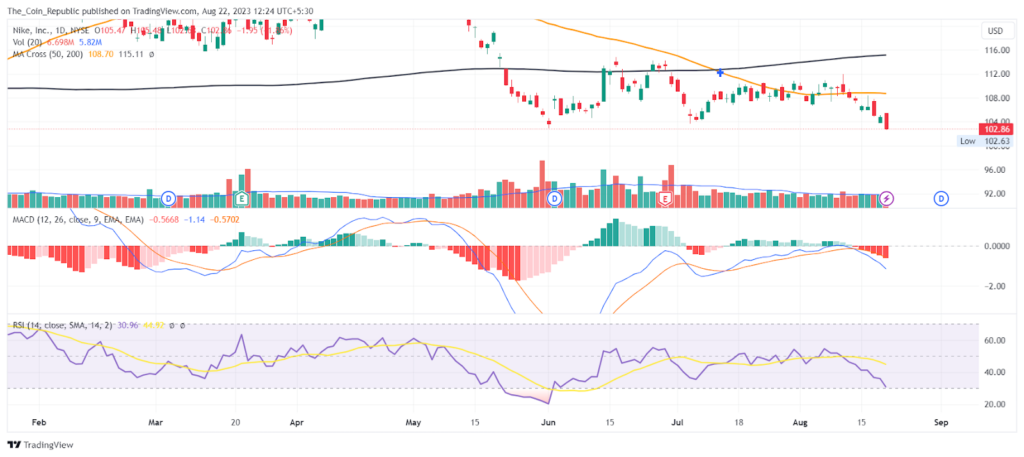
The overall technical indicators including RSI and MACD opinion rating for the stock is a 24% buy with a weakening short-term outlook on maintaining the current trend.
Conclusion
Visa stock price has been falling for six days in a row, forming a double-top pattern near an all-time high of $252. The stock has been bullish for the last two quarters but lost momentum at $250. The price is now below the 50-day EMA and near the 200-day EMA, which is a key support zone. The short-term trend is bearish, but the long-term trend is still bullish. Analysts have a positive outlook for Visa, with a potential upside of 46% in one year.
Technical Levels
- Support levels: $226.76 and $221.97.
- Resistance levels: $234.91 and $240.71.
Disclaimer
The views and opinions stated by the author, or any people named in this article, are for informational purposes only and do not establish financial, investment, or other advice. Investing in or trading crypto or stock comes with a risk of financial loss.

Adarsh Singh is a true connoisseur of Defi and Blockchain technologies, who left his job at a “Big 4” multinational finance firm to pursue crypto and NFT trading full-time. He has a strong background in finance, with MBA from a prestigious B-school. He delves deep into these innovative fields, unraveling their intricacies. Uncovering hidden gems, be it coins, tokens or NFTs, is his expertise. NFTs drive deep interest for him, and his creative analysis of NFTs opens up engaging narratives. He strives to bring decentralized digital assets accessible to the masses.


