
 Home
Home News
News

- 1 The price of the Fisker share is trading in a range.
- 2 The Gross margin of the company has very highly declined by more than 2000%.
Fisker Inc. was founded by Henrik Fisker and his wife Geeta Gupta-Fisker. It is an automotive company. The company was founded in the year 2007. It has its headquarters situated in California U.S. A few of the most popular cars of Fisker are Fisker Alaska, Fisker Pear, and Fisker Ocean. In 2020 Henrik Fisker announced an IPO in the New York Stock Exchange.
Fisker Inc. has a market cap of $1.997B. It has 191.796M floating shares in the market. As the FSR share moves more than the market, its beta value is 2.79. The FSR company has a relatively negative EPS of -$1.65. The price-to-earnings ratio of the FSR is -3.83.

Fifthdelta Ltd holds the largest percentage in the company with 9.14%. The Vanguard Group is also in the game at second position with 8.62% of holding of FSR share. Fisker assets have given a negative return of -33.5% in Q2 2023, resulting in a decline of 9.2% year-on-year.
Fisker Inc. Stock Performance Analysis
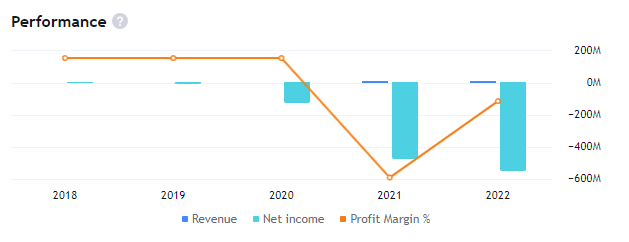
The company is very new in the sector due to which it does not have made any significant sales or figures in revenue. Currently, the profit margin and the net income of the company are highly negative. The FSR made a revenue of $342.00K in the year ending 2022. Currently, the company has a debt of $695.79M.
Technical Summary of FSR Stock
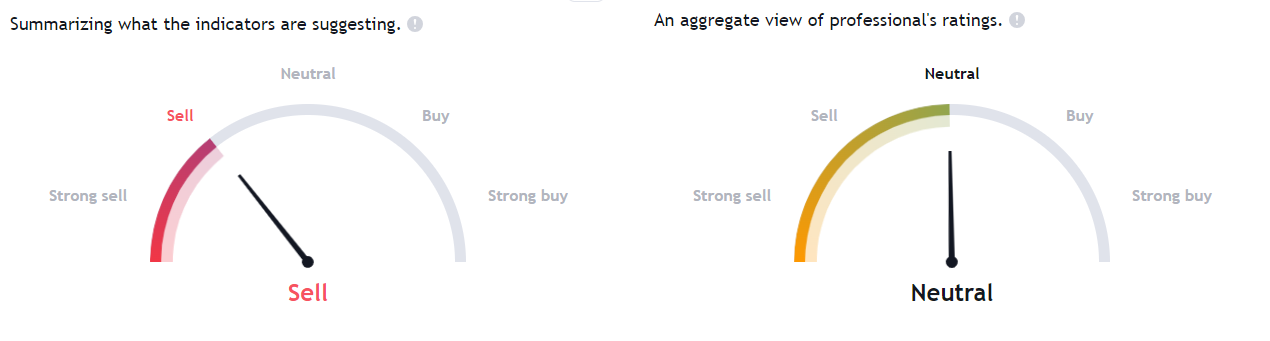
The technicals for the company are negative to uncertain and the company has not done any significant business yet. It is in the development stage and the financials of the company can act as a hoax for judgment. Thus, the experts are neutral on the stock.
FSR Share Technical Analysis
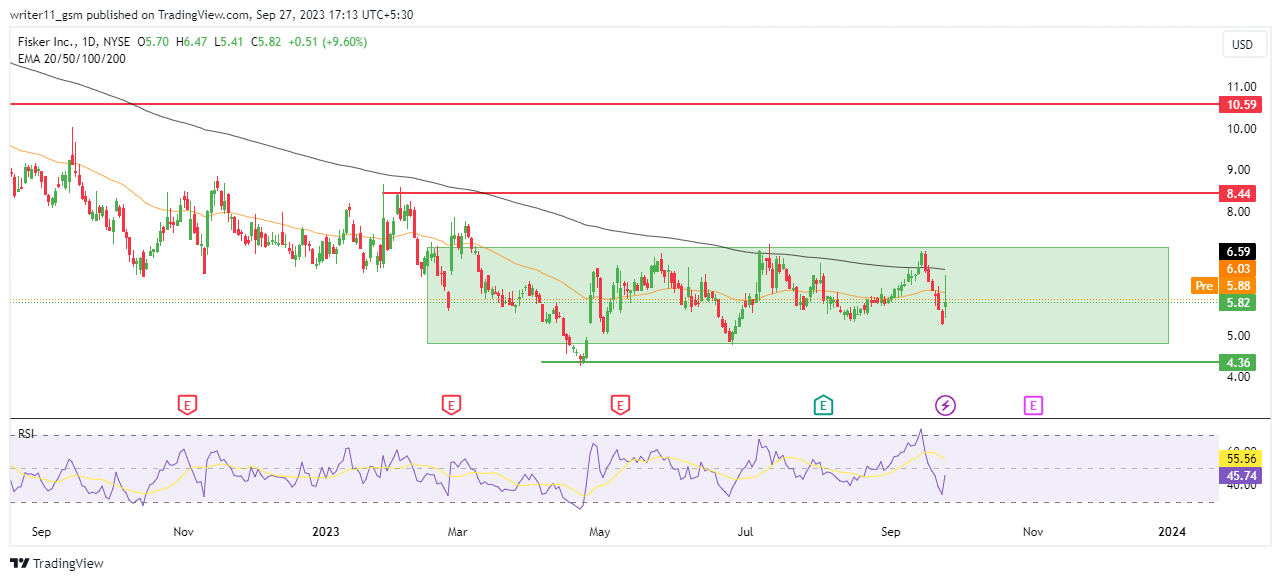
The FSR share price is consolidating in a range, presenting uncertainty in the trend of the stock. The share is making equal highs and equal lows on the charts. Due to a consistent decline in share price, the 50-day and the 200-day EMAs are trading in a downtrend. It indicates the presence of sellers in the stock.
The RSI for the share is also declining from the higher level and is indicating volatility on the charts. The RSI has also broken down below the 14-day SMA and the 50-level. It represents a weakness in the price of the share.
Conclusion
The share price of Fisker Inc. is trading in a downtrend and the indicators are indicating bearish signals on the chart. The EMA is trading in a death cross and the RSI is also acting bearish.
Therefore, the share price of Fikser can remain volatile to range-bound unless it breaks above or below the consolidation zone.
Technical Levels
- Support levels for the FSR share are – $4.30 and $5.00
- Resistance levels for the FSR share are – $8.50 and $10.50
Disclaimer
The information provided in this article, including the views and opinions expressed by the author or any individuals mentioned, is intended for informational purposes only. It is important to note that the article does not provide financial or investment advice. Investing or trading in cryptocurrency assets carries inherent risks and can result in financial loss.
Steve Anderson is an Australian crypto enthusiast. He is a specialist in management and trading for over 5 years. Steve has worked as a crypto trader, he loves learning about decentralisation, understanding the true potential of the blockchain.


