
 Home
Home News
News

- 1 AMC stock price crashed more than 4% in intraday on Wednesday, 27 September.
- 2 AMC stock price crashed more than 4% in intraday on Wednesday, 27 September.
- 3 The Analysts offering a 1-year price forecast observe a maximum potential of 490% on the upside.
AMC Entertainment Holdings, Inc. (AMC) stock has been on a roller coaster ride in recent times. The stock price has been affected a lot since the COVID-19 pandemic due to the lockdown and the rise of other streaming services.
However, AMC, being an entertainment giant is considered a significant brand. It is the largest movie theater chain in the world, with over 950 theaters and 10,500 screens in 15 countries. AMC’s revenue is primarily dependent on box office revenue, so the performance of new movies will have a substantial impact on the company’s stock price.
The recent price analysis of AMC Entertainment Holdings, Inc. stock shows that the stock is struggling to recover from the decline. AMC stock shows an accumulation near a record-low price of $7 and forms a bullish flag pattern.

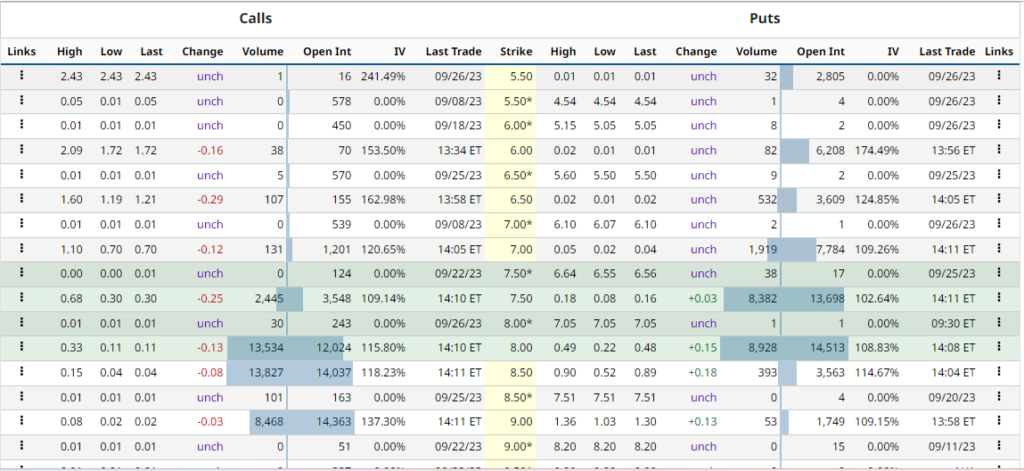
AMC stock option-chain analysis states that the current implied volatility in the market is 102.36% with a decrement of 2.73% in the last trading session. The at-the-money strike has an OI of 13,698 on the PUT side and 3,569 on the CALL side indicating the complete domination of buyers at the CMP.

AMC Stock Price Shows The Formation Of A Bullish Flag Over 1-D Chart
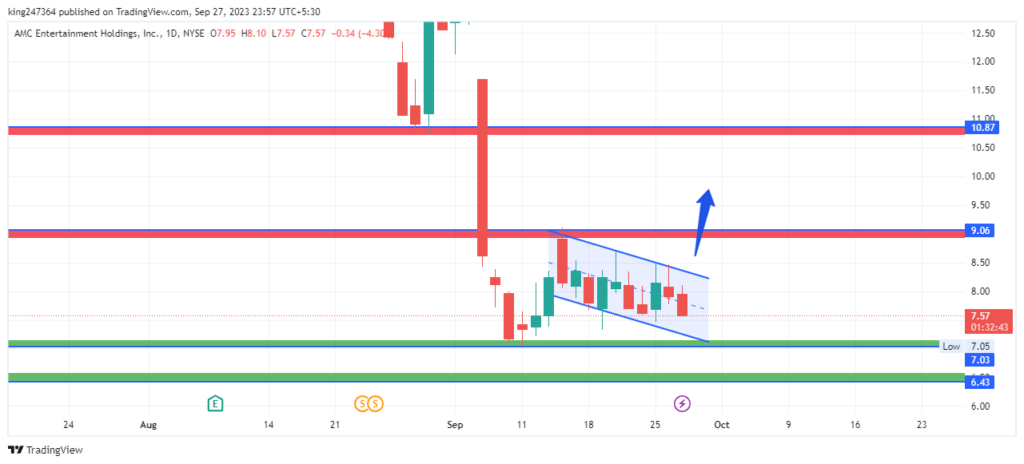
The AMC stock price currently trades at $7.60 with a decline of 4% in intraday. The stock is attempting to recover and delivers a bullish flag over the daily chart. The stock price may remain neutral and the trend may be indecisive until it is maintained in the channel.
The breakout of the bullish flag pattern may surge the price higher and the price may test the upper levels of $9 and $10 in the coming sessions. Moreover, the option chain data shows the dominance of buyers at the CMP indicating that the buyers are able to defend the current level and try to take the price to higher levels.
The analysts offering a 1-year price forecast for AMC stock observe a maximum potential of 495% to the upside that could take the price to a high of $45. The bearish outlook of the analysts stands at a drawdown of 41% which could drag the price to a low of $4.41.
The Technical Indicators Show an Optimistic Trend
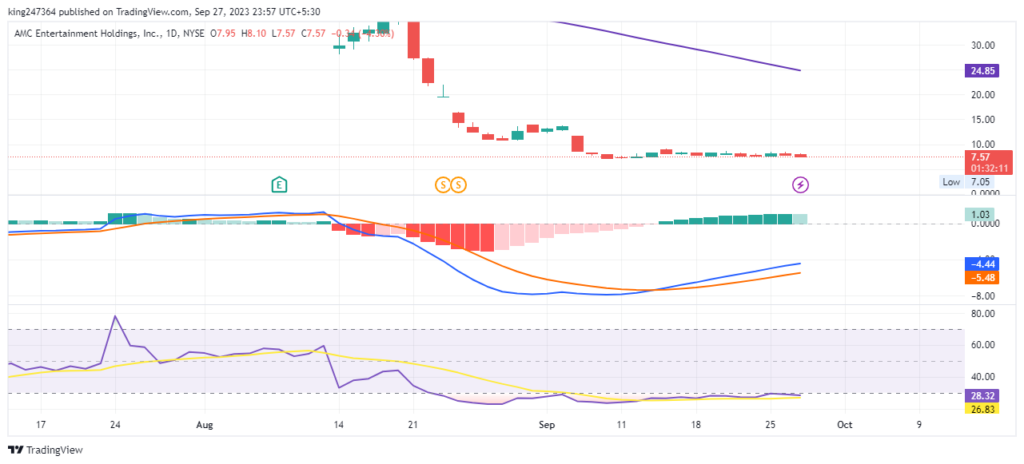
The daily AMC stock price chart shows that the price is trading below the key moving average of 50 and 200-day EMA. At press time, the MACD lines are showing a positive crossover indicating an optimistic trend in the short term.
The overall Technical Opinion rating including RSI and MACD signals a 90% sell with a weakening short-term outlook on maintaining the current direction.
Conclusion
AMC Entertainment Holdings, Inc. (AMC) is the largest movie theater chain in the world. The recent price analysis shows that the stock is struggling to recover from a decline and forms a bullish flag pattern. The stock price may remain neutral until it breaks out of the pattern. Analysts offer a 1-year price forecast with a maximum potential of 495% to the upside and a bearish outlook of a 41% drawdown.
Technical Levels
- Support levels: $7.03 and $6.43.
- Resistance levels: $9.06 and $10.87.
Disclaimer
The views and opinions stated by the author, or any people named in this article, are for informational purposes only and do not establish financial, investment, or other advice. Investing in or trading crypto or stock comes with a risk of financial loss.

Nancy J. Allen is a crypto enthusiast, with a major in macroeconomics and minor in business statistics. She believes that cryptocurrencies inspire people to be their own banks, and step aside from traditional monetary exchange systems. She is also intrigued by blockchain technology and its functioning. She frequently researches, and posts content on the top altcoins, their theoretical working principles and technical price predictions.


