
 Home
Home News
News
- 1 Bitcoin Cash (BCH) price lifted off 9.51% in the last 24 hours and is currently trading at $235.61.
- 2 Bitcoin Cash (BCH) price took support from the 50-day EMA and surged higher.
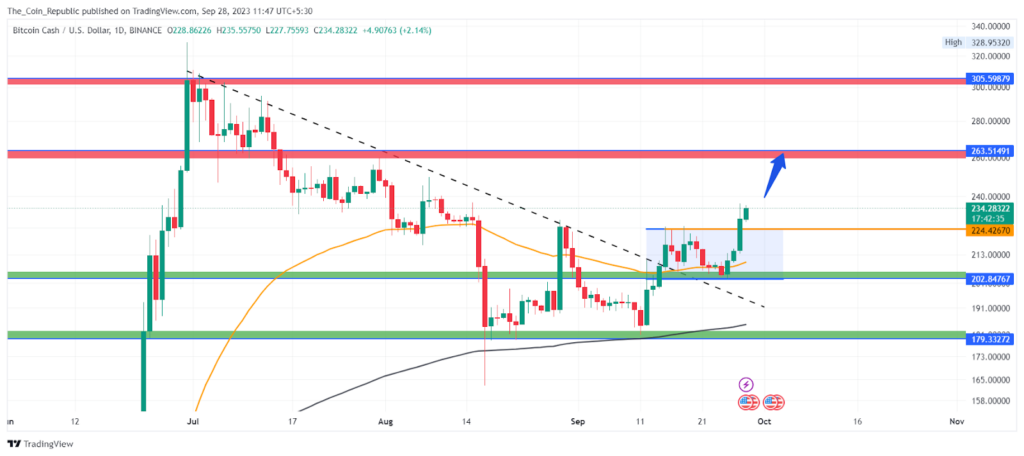
- 3 The daily chart illustrates the breakout and retest of an upper trendline resistance.
The Bitcoin Cash price is up by 9.5% at the time of writing and is committed to gaining more by the end of the intraday session. The bulls hold control over the trend and the price might show gains to test the upper supply levels of $300.

The daily chart illustrates the breakout followed by a retest of the previous breakout zone. The price accumulated the buying volume near the 50-day EMA and surged to break above the previous high, thus forming a positive price action. The price trend analysis states that the BCH crypto price witnessed a surge of over 150% in the last week of June taking the price from $100 to a high of $300. Thereafter the short-term surge triggered a profit booking and the crypto price slumped below the $200 level.
However, the bears lost momentum near the 200-day EMA and the price witnessed an accumulation followed by a price hike leading to the breakout of the upper trendline resistance.

Bitcoin Cash Price Prediction Using Price Action Strategy
Recently, the Bitcoin Cash price observed a retest of the breakout near the $200 level where the bulls had firmly established their positions and the price showed a breakout. The overall crypto market is bullish boosting the price trend and the BCH crypto price observed a gain of nearly 10% in the last 24 hours.
Also, the volume analysis shows that the BCH token has received a $186.54 Million volume in the past 24 hours which is 186.54% more than the past day. The volume-to-market cap is 10.21% indicating mild volatility in the crypto.
BCH Price Forecast from Indicators’ point of view
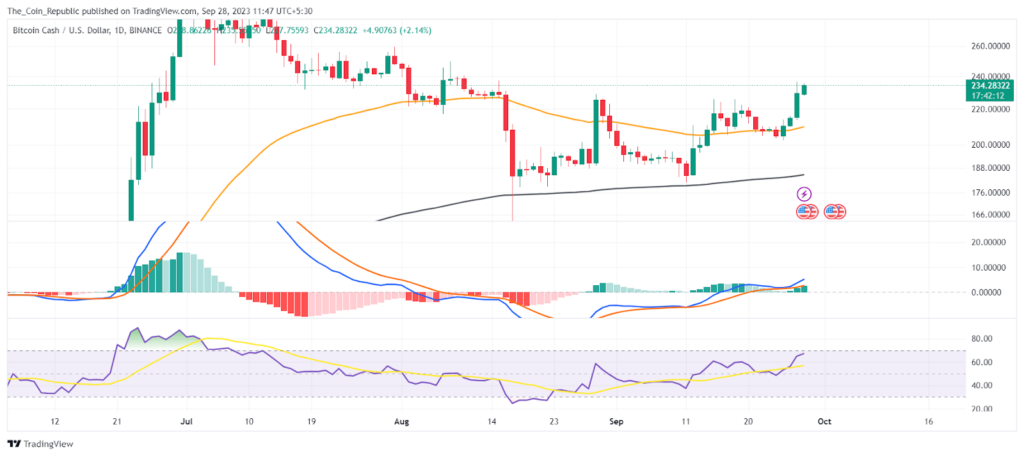
As per the EMA analysis, the BCH price showed a breakout of the 50-day EMA indicating that buyers are dominating the trend. The price is trading above the 200-day EMA.
At the time of publishing, the RSI value of the BCH token is 66.7 and that of the SMA line is 54.3. RSI is headed upwards taking support from the SMA line indicating an optimistic trend.
MACD lines have made a bearish crossover. Also, Histogram bars are being formed above the mean line with increasing height indicating bulls dominating the market.
Conclusion
The Bitcoin Cash price is bullish after breaking out of the upper trendline resistance and retesting the breakout zone near the $200 level. The price is up by 9.5% and might test the $300 level. The price trend is supported by the bullish crypto market and the high volume. The volume-to-market cap is 10.21% indicating mild volatility. The price is above the 50-day and 200-day EMA showing positive momentum.
Technical Levels
- Support levels: $202 and $179.3.
- Resistance levels: $263.5 and $305.75.
Disclaimer
The views and opinions stated by the author, or any people named in this article, are for informational purposes only and do not establish financial, investment, or other advice. Investing in or trading crypto or stock comes with a risk of financial loss.

With a background in journalism, Ritika Sharma has worked with many reputed media firms focusing on general news such as politics and crime. She joined The Coin Republic as a reporter for crypto, and found a great passion for cryptocurrency, Web3, NFTs and other digital assets. She spends a lot of time researching and delving deeper into these concepts around the clock, and is a strong advocate for women in STEM.


