
 Home
Home News
News

- 1 PRU stock price prediction: The stock is falling despite strong growth in its earnings report.
- 2 The stock has experienced a long bearish sentiment since April of this year.
- 3 The current price is in the demand zone with hopes high for the bulls. See the price prediction below
Financial services provider Prudential (LON: PRU) has seen a fall of more than 24% since April of this year. It has puzzled the long-term investors of the stock.
The Maze for Bulls
The reason is the impressive half-yearly report of the company during this period. Within the Semi-annual report of June 2023, the company skilled its revenue growth of 8.3% as compared to Half half-yearly document of December of 2022. When looking back, it becomes clear that the reason behind the drop in the PRU stock price isn’t because of any shortcomings in the company’s underlying performance

One of the mind-boggling things is the company’s earnings Net income. It grew over 854% (year on year) during the period and has contributed to its Return on equity of 11.4%. That opens up a new maze about why the stock is still falling, despite a strong fuselage and, given the absence of any negative news.
What are Others Saying?
Some investors believe that the fall in stock price is due to external factors, such as geopolitical risks or the increment in inflation all over Europe. Others speculate that there might be some hidden factors that have not been disclosed by the firm yet.
Technical Analysis and Prediction of the PRU Stock Price
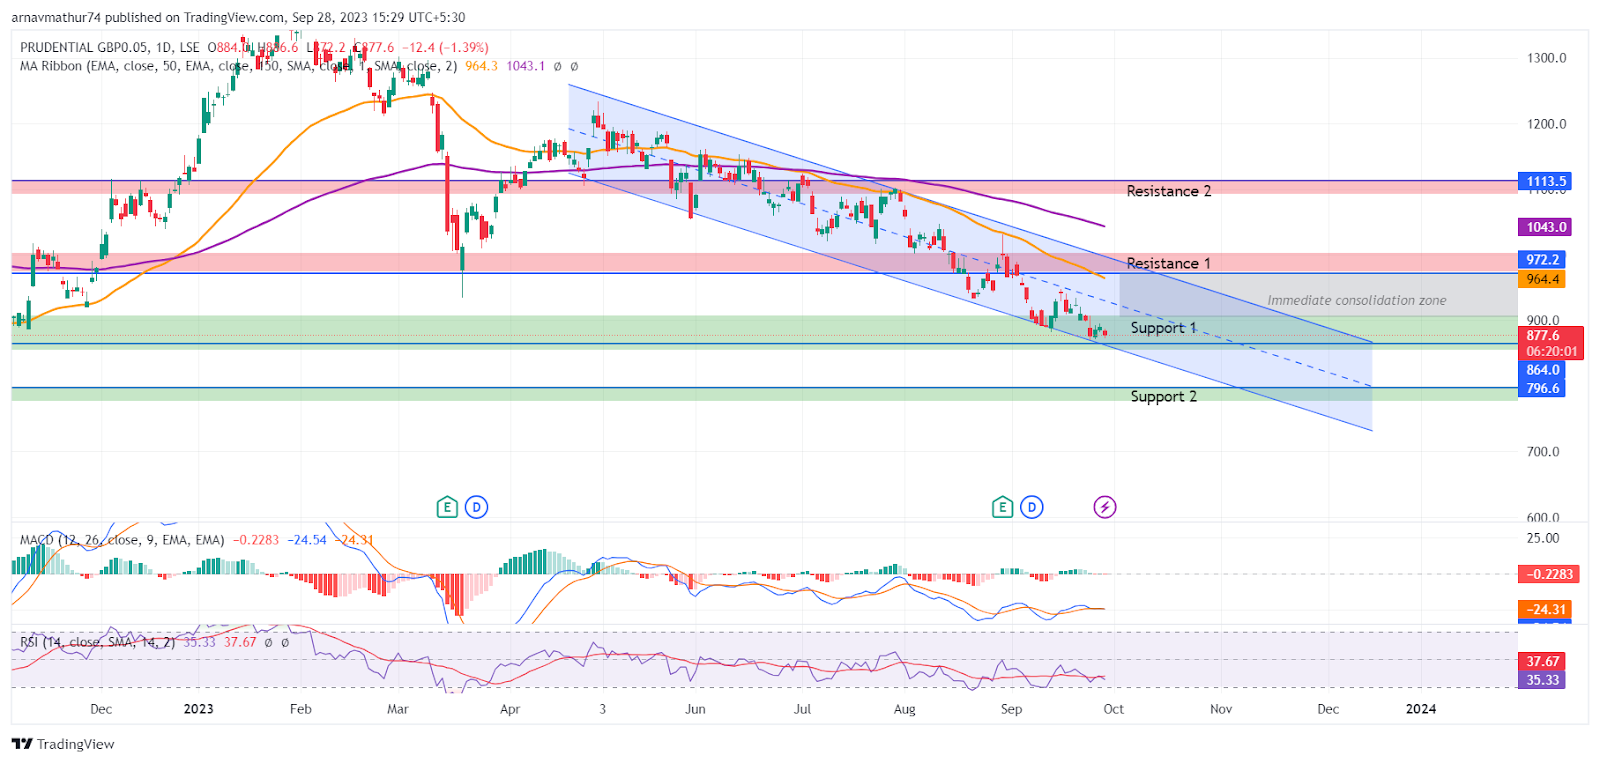
As of this writing, the PRU stock price is trading at the level of £868. The stock is in its demand zone of £864. However as the parallel channel is showing, the price is making lower highs every time while breaking its support levels.
To break this trend, investors have to make new a high above the previous one and then sustain above that level. That action is far from being a reality without a strong bullish momentum on any given day. Therefore if the stock breaks the current support level of £864, it will continue the same mysterious downtrend.
Furthermore, Indicators like MACD and RSI are showing a consolidated trend. while the 50-day EMA on £964 is acting as a continuous resistance to the bulls. The RSI line is at 35 which is showing a weak strength in the bullish momentum. the current level is just below the neutral territory of 50. Meanwhile, the MACD is down below at -24 from its neutral level of zero.
Conclusion
The PRU stock has fallen mysteriously since April of this year despite its good financial reports over the period. Currently, there is a downtrend in the stock and it is likely to be that way since the bears are on the way to breaking another support, hence the PRU stock price prediction is bearish.
Technical Levels
Support: £972, and £1113
Resistance: £864, and £796
Disclaimer
The views and opinions stated by the author, or any people named in this article, are for informational purposes only. They do not establish financial, investment, or other advice. Investing in or trading crypto assets comes with a risk of financial loss.

Andrew is a blockchain developer who developed his interest in cryptocurrencies while pursuing his post-graduation major in blockchain development. He is a keen observer of details and shares his passion for writing, along with coding. His backend knowledge about blockchain helps him give a unique perspective to his writing skills, and a reliable craft at explaining the concepts such as blockchain programming, languages and token minting. He also frequently shares technical details and performance indicators of ICOs and IDOs.


