
 Home
Home News
News

- 1 Synthetix crypto price decreased by 4.70% over the past seven days.
- 2 Synthetix crypto price is currently trading at $2.008 with a drop of 0.89% in the last 24 hours and a current market cap of $543.277 Million.
The Synthetix crypto continues to exhibit weakness on the charts, with sellers exerting significant pressure in recent trading sessions. Furthermore, the chart structure favors the bears, and the price continued to form negative candles, which shows a fight between bears and bulls.

At the time of writing, the Synthetix crypto price was $2.008 with an intraday drop of 0.89%, indicating bearishness. Buyers are making efforts to gain traction in the market, but they were only able to secure a few critical support levels. Intraday trading volume is $33.782 Million. Moreover, SNX crypto suggests further volatility in the following sessions.

The Synthetix crypto is in a downtrend on the daily charts and has underperformed in the past months. Furthermore, the technical indicators continue to signal bearishness, with no signs of a bullish reversal or bounce below the lower levels.
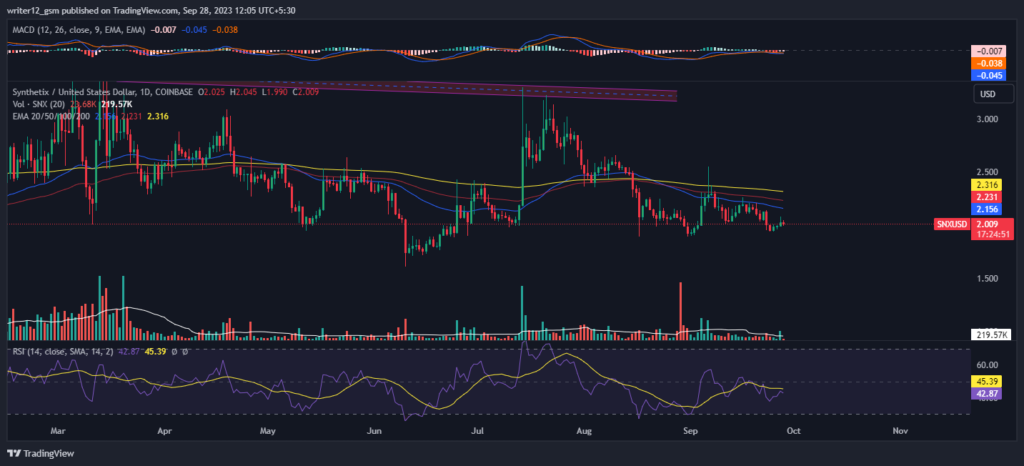
Technical Analysis of Synthetix Crypto Price in 1-D Time Frame
On the 4-hour charts, Synthetix token is under the control of the sellers, and buyers were not able to surpass the neutral range. The price action indicates that sellers are persistently pushing back against the bulls below the lower trajectory, causing the gains from the top to erode.
The relative strength index (RSI) curve is near the neutral range of 48, indicating negative divergence and bearishness on the charts.The MACD is neutral, and both the moving averages converged, which suggests that a significant move can be seen in the upcoming sessions.
At the time of publishing, Synthetix crypto (USD: SNX) is above the 50 and 200-day SMAs (simple moving averages), which are supporting the price trend.
However, if selling volume adds up, then the price might conquer supporting SMAs by making lower highs and lows. Hence, the SNX price is expected to move downwards giving bearish views over the daily time frame chart. The current value of RSI is 42 points. The 14 SMA is below the median line at 45 points which indicates that the Synthetix crypto is bearish.
The MACD line at -0.045 and the signal line at -0.045 are above the zero line. A bearish crossover is observed in the MACD which signals more bearishness for the SNX crypto price.
Summary
Synthetix (USD: SNX) technical oscillators are bearish. The MACD, RSI, and EMAs are emphasizing negative signs and imply that the downtrend may continue in the SNX crypto price. Investors and traders are bearish on the 1-D time frame.
Technical Levels
- Support Levels: $1.661 and $1.394.
- Resistance Levels: $2.425 and $2.922.
Disclaimer
This article is for informational purposes only and does not provide any financial, investment, or other advice. The author or any people mentioned in this article are not responsible for any financial loss that may occur from investing in or trading. Please do your own research before making any financial decisions
Steve Anderson is an Australian crypto enthusiast. He is a specialist in management and trading for over 5 years. Steve has worked as a crypto trader, he loves learning about decentralisation, understanding the true potential of the blockchain.


