
 Home
Home News
News

- 1 Carnival stock price is taking support on the 200 EMA curve.
- 2 CCL stock price has been facing bearish pressure over the past sessions.
CCL stock price has been on a downtrend for the past three months, as it faced resistance from the higher levels and formed lower lows. This shows that the bears have been in control and the stock has lost momentum. The stock has also broken below the key moving averages, which indicates further weakness. However, in recent sessions, Carnival stock price is taking support on the 200-day EMA.
The stock shows a bearish pattern. It lost the gains it made in the previous months this year. CCL stock has returned to its previous breakout level, which could act as support. Technical analysis suggests that the stock is oversold and could bounce back from the lower levels. However, the stock is showing signs of strength and a reversal confirming a pullback rally from lower levels.

CCL stock price is in a correction phase but is near the crucial support level of 200 EMA. It formed a bullish candle indicating that buyers are active and will try their best to rebound. Carnival stock price closed the previous session at $14.44 with an intraday rise of 3.29%. If buyers succeed in defending the current support then the possibility of a bounce back will increase. However, if the sell-off continues and Carnival stock drops below lower levels, more downfall is possible.
Buyers tried multiple times to break the higher range and expand upwards. However, due to the strong presence of sellers, prices faced rejection. It shows sellers are still active on higher levels.
Will CCL Stock Price Take a Reversal From Lower Levels?
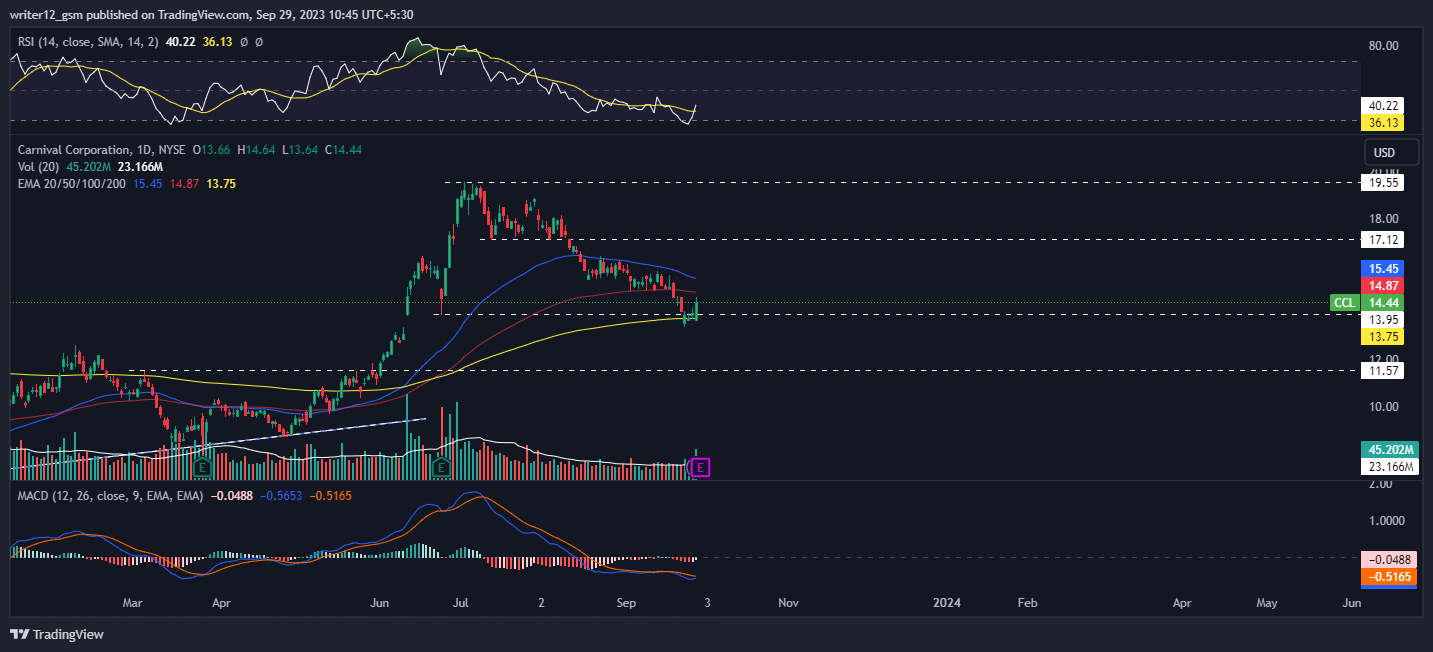
CCL price is below the downward-sloping 50-day and 100-day EMAs showcasing a downtrend. However, the Carnival price has taken support on 200 EMA and probably bounce back from there.
The MACD generated a negative crossover and the histogram is also red, indicating bearishness. The RSI denotes weakness but is near the oversold territory. The current value of RSI is 40.22 points. The 14 SMA is below the median line at 36.13 points which indicates that the CCL stock price is bearish.
Weekly-Time Horizon Analysis
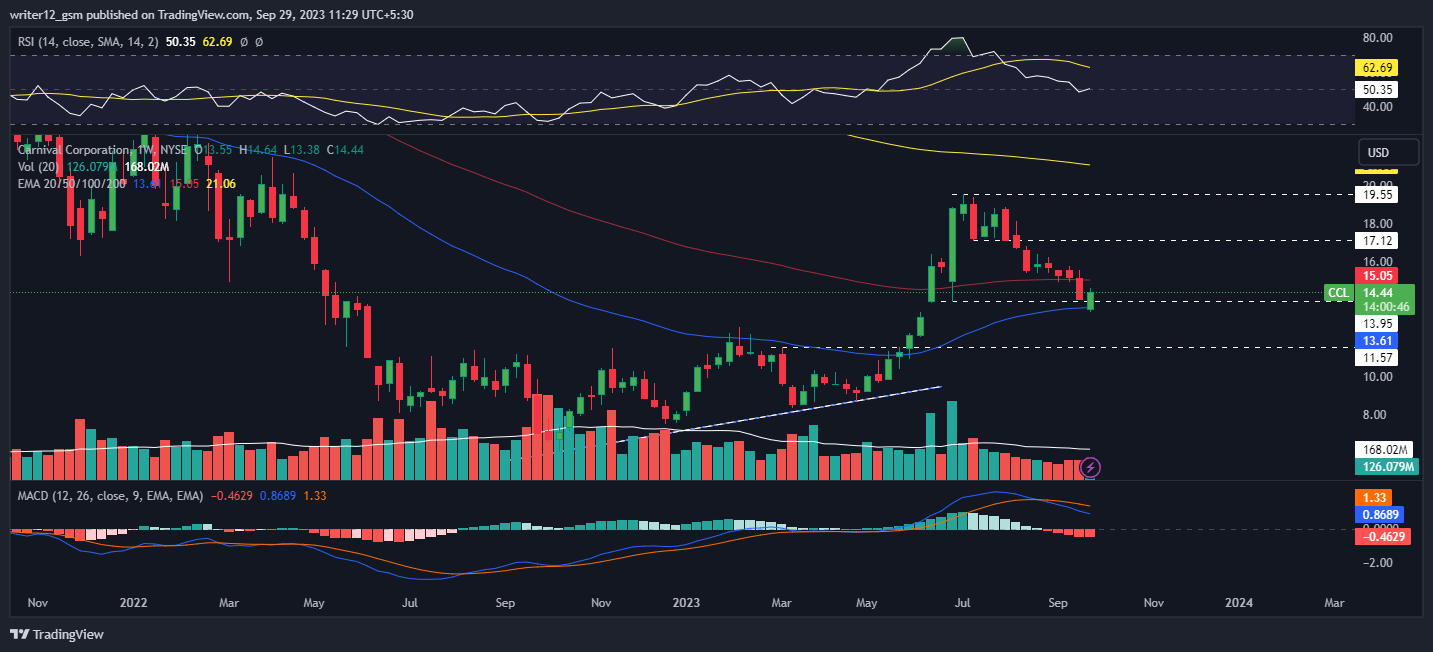
CCL stock has shown sellers’ strength on the weekly charts. Moreover, the price is below the key EMAs, currently taking support at 50 EMA, which shows further weakness in the stock. The RSI curve is near the oversold region at 50, and a negative outlook was noted, indicating bearishness in the stock. The MACD persisted to form red bars, and a bearish crossover was noted, which signals corrective moves.
Summary
CCL stock price has been in a downtrend for a prolonged time. It is trading near the value of $14.44 breaking below 50 and 100-day EMA. Currently, Carnival stock price is taking support on the 200-day EMA and is trying to bounce back from current levels. Moreover, the RSI, MACD, and EMAs are giving mild signals of a reversal.
Technical Levels
- Support Levels: $11.57 and $10.00
- Resistance Levels: $13.95 and $17.12
Disclaimer
This article is for informational purposes only and does not provide any financial, investment, or other advice. The author or any people mentioned in this article are not responsible for any financial loss that may occur from investing in or trading. Please do your own research before making any financial decisions.

With a background in journalism, Ritika Sharma has worked with many reputed media firms focusing on general news such as politics and crime. She joined The Coin Republic as a reporter for crypto, and found a great passion for cryptocurrency, Web3, NFTs and other digital assets. She spends a lot of time researching and delving deeper into these concepts around the clock, and is a strong advocate for women in STEM.


