
 Home
Home News
News
- 1 NKE stock price is below neutrality and showing bearishness.
- 2 Buyers are losing momentum and are heading to the oversold region.
Nike Inc. (NYSE: NKE) stock price is heading toward the demand zone of $80 and has been showing bearishness for the past number of sessions. Moreover, the chart shows the rounding top pattern and witnessed selling pressure. Furthermore, the price action shows short buildup activity and indicates that sellers have gained traction and pushed NKE stock below the crucial support zones. Moreover, the technicals suggest that bulls may lose the neutral trajectory, and NKE stock will shift to the lower trajectory below $80 in the upcoming sessions.
NKE stock has persisted in forming lower lows and is losing the gains among its peers. Furthermore, the NKE stock price is trading below the significant moving averages and is below the cluster of $90, showing seller dominance. As per the options chain, at the strike price of $90, massive open interest on the call side of 2.44 hundred thousand shares was there, whereas on the put side, it was 3.50 Lakh, which showcased that long positions were trapped, and a pullback toward $90 can be anticipated soon.
At the press time, NKE stock price was trading at $89.63 with an intraday gain of 0.23%, showing neutrality on the charts. Moreover, the trading volume increased by 2.65% to 16.14 Million, while the market cap is $137.141 Billion. However, analysts maintained a neutral rating with a yearly target price of $122.21, suggesting a hawkish scenario for the upcoming sessions.
NIKE, Inc. designs, develops, markets, and sells athletic footwear, apparel, accessories, equipment, and services. It operates through the following segments: North America, Europe, Middle East & Africa, Greater China, Asia Pacific & Latin America, Global Brand Divisions, Converse, and Corporate. The segments of North America, Europe, Middle East & Africa, Greater China, and Asia Pacific & Latin America refer to the design, development, marketing, and selling of athletic footwear, apparel, and equipment.
NKE Stock Forms Rounding Top Pattern on Daily Charts
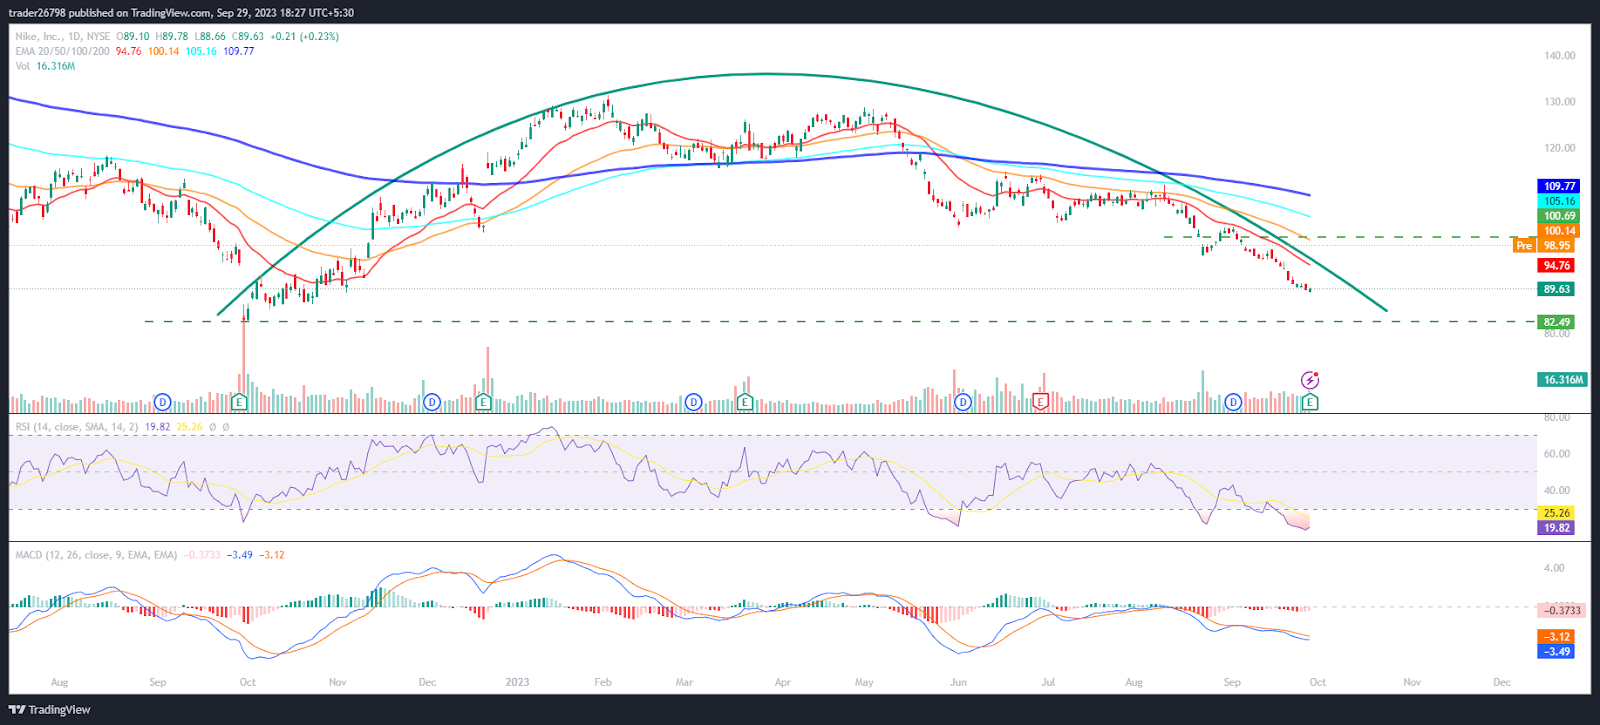
On the daily charts, NKE stock price is below neutrality and is heading toward the demand zone of $80, showing bearishness. However, the chart shows that bulls were trying to attain a pullback and hovering to retain the spot of $90. Moreover, the price is below the 38.2% Fib zone and is close to the lower Bollinger band.
The RSI curve is below the oversold region close to 25, where a rebound can be anticipated soon.
The MACD indicator shows a bearish crossover and persisted in forming red bars on the histogram, suggesting a negative outlook for the upcoming sessions.
Summary
NKE stock price is below the cluster of $100 showing bearishness for the past sessions. However, the chart structure suggests that NKE stock may attain a pullback and will retest the 20-day EMA soon. Furthermore, the price action shows the seller dominance and suggests follow-on selling will persist and may reach $80 in the upcoming sessions.
Technical Levels
Support Levels: $85 and $80
Resistance Levels: $95 and $100
Disclaimer
The views and opinions stated by the author or any other person named in this article are for informational purposes only and do not constitute financial, investment, or other advice. Investing in or trading crypto or stocks comes with a risk of financial loss.

With a background in journalism, Ritika Sharma has worked with many reputed media firms focusing on general news such as politics and crime. She joined The Coin Republic as a reporter for crypto, and found a great passion for cryptocurrency, Web3, NFTs and other digital assets. She spends a lot of time researching and delving deeper into these concepts around the clock, and is a strong advocate for women in STEM.


