
 Home
Home News
News
- 1 Hedera Hashgraph crypto price decreased by 0.49% over the past seven days.
- 2 HBAR crypto price is currently trading at $0.05004690 with a rise of 0.08% in the last 24 hours with a current market cap of $1,667 Billion.
- 3 Hedera Hashgraph is under bearish pressure.
The HBAR Crypto price prediction suggests the token produced an interesting declining pattern. The crypto is struggling to move above 20, 50, 100, and 200-day daily moving averages.
The Hedera HashgraphUSD price prediction shows that the token is trying to break the upper trendline on the daily time frame chart. Hedera Hashgraph crypto needs to increase the positive momentum in order to break out from the descending pattern. However, sellers may approach 50-SMA which is acting as a resistance to the crypto price. However, the 24-hour trading volume is 46.803 Million.
Hedera Hashgraph price prediction implies that investor sentiments regarding the Hedera Hashgraph token are bearish. Investors may prefer to keep a keen watch over the crypto. Presently, the Hedera Hashgraph price is below all the key EMA and MA levels.
The present value of Hedera Hashgraph is $0.05004690. It has a market capitalization of around $1.667 Billion with a fully diluted market cap of $2.499 Billion. The crypto has a circulating supply of 33.358 Billion.
Hedera HashgraphUSD has performed poorly so far this year. Year-over-year returns are 37.41% while returns over the past 6 months are -29.50%. The return was -11.22% last month and -0.49% last week. Technicals signal selling pressure while the technical oscillators indicate neutrality. The moving averages are also on the strong sell side. This shows bearish dominance in the market.
Technical Analysis of Hedera Hashgraph Crypto Price in 1-D Timeframe
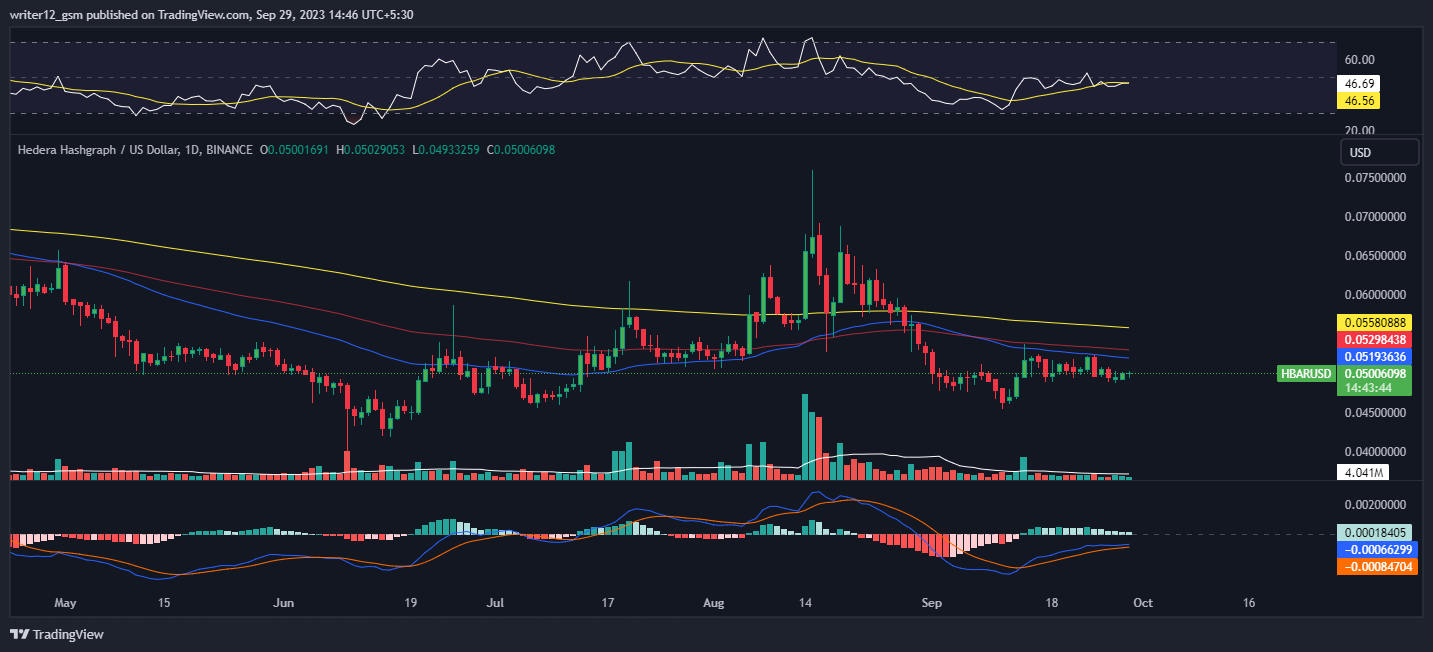
At the time of publishing, Hedera Hashgraph crypto is trading below the 50 and 200-day simple moving averages, which shows bearish momentum.
However, if selling volume adds up, then the price might conquer supporting SMAs by making lower highs and lows. Hence, the Hedera Hashgraph price is expected to move downwards giving bearish views over the daily time frame chart. The current value of RSI is 46 points. The 14 SMA is trading sideways, below the median line at 46 points which indicates that the Hedera Hashgraph crypto is neutral.
The MACD line at -0.0006607 and the signal line at -0.00084658 are below the zero line. A bearish crossover is observed in the MACD which signals more bearishness for the Hedera Hashgraph crypto price.
Summary
Hedera Hashgraph crypto technical oscillators also support the bearish trend. The MACD, RSI, and EMAs are emphasizing negative signs and imply that the downtrend may continue in the Hedera Hashgraph crypto price. Hedera Hashgraph’s price action suggests that the investors and traders are bearish on the 1-D time frame. The price action reflects a bearish perspective at the moment.
Technical Levels
- Support Levels: $0.04346389 and $0.03426693.
- Resistance Levels: $0.06893540 and $0.08520995.
Disclaimer
This article is for informational purposes only and does not provide any financial, investment, or other advice. The author or any people mentioned in this article are not responsible for any financial loss that may occur from investing in or trading. Please do your own research before making any financial decisions
Mr. Pratik chadhokar is an Indian Forex, Cryptocurrencies and Financial Market Advisor and analyst with a background in IT and Financial market Strategist. He specialises in market strategies and technical analysis and has spent over a year as a financial markets contributor and observer. He possesses strong technical analytical skills and is well known for his entertaining and informative analysis of the Financial markets.


