
 Home
Home News
News
- 1 The Graph price (GRT) surged 2.12% in the past 24 hours and is currently trading at $088.
- 2 The daily chart shows that The Graph price struggles to break above the 50-day exponential moving average.
- 3 GRT price forms an inverted head and shoulder pattern over the 1-D time frame.
The Graph price chart illustrates the formation of an inverted head and shoulders pattern over the daily chart. Currently, the crypto is busy forming the right shoulder of the GRT crypto. The completion of the pattern may lead to a breakout which may turn the price trend in favor of buyers.
The price action analysis states that the GRT crypto has been on a declining trend for the last six months wiping out more than 35% of its market capitalization. Over the past few sessions, the overall crypto market is showing an optimistic trend and the cryptos are gaining momentum one by one. The Gaph might be the next one.
The Graph is a decentralized public infrastructure that uses Graph Tokens (GRT) to ensure data security and quality. GRT is a work token that is locked by indexers, curators, and delegators who provide indexing and curating services to the network.
The Graph Price Forms An Inverted Head And Shoulder Pattern
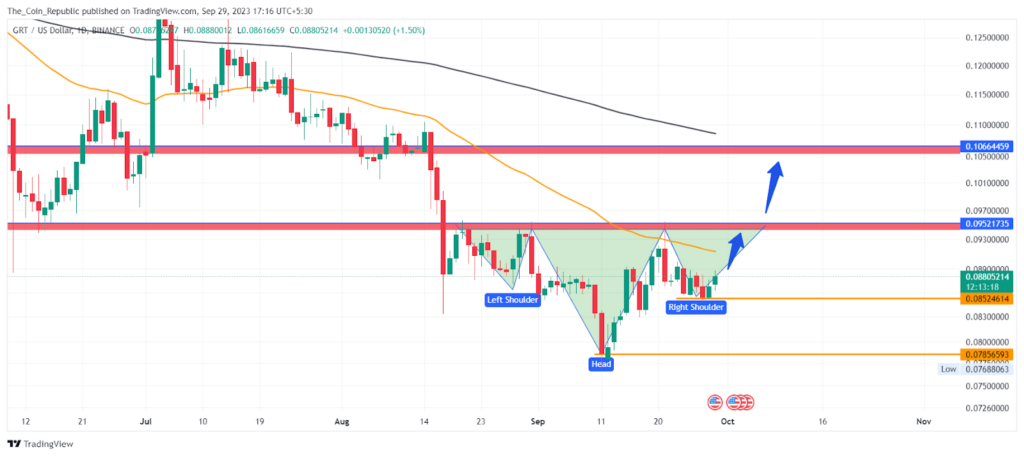
The Graph price currently trades at $0.088 with an intraday gain of 2.12%. The GRT price currently consolidates near the 50-day EMA and shows the formation of the right shoulder of the inverted head and shoulder pattern.
The breakout of the pattern may surge the price to the upper supply levels. However, the bulls must surpass above the 50-day EMA in order to show the gains.
The volume analysis shows that The Graph Crypto has received a total of $20.76 Million volume in the last 24 hours which is 20% more than the last day’s volume. The crypto has a volume-to-market cap of 2.5% indicating low volatility in the market. The GRT crypto has a market capitalization of $811.2 Million and ranks 44th in the crypto market.
Technical Indicators Show Optimistic Signals for GRT
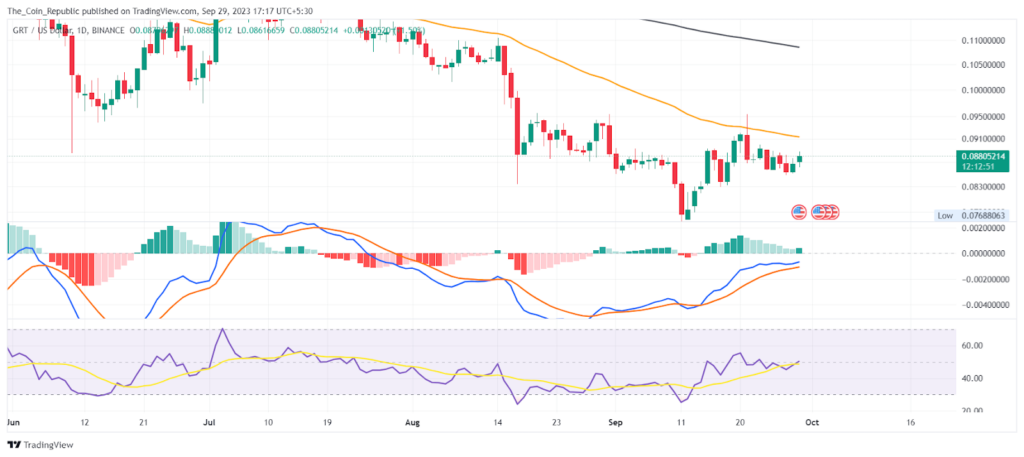
MACD lines are showing a positive crossover. The histogram bars are also being formed above the mean line of increasing height, indicating the bulls are regaining momentum.
The EMA analysis shows that the GRT price struggles to sustain near the 50-day EMA. Also, the price trades below the 200-day EMA indicating a bearish trend prevailed.
Conclusion
The Graph is a decentralized public infrastructure that uses GRT tokens to secure and improve data quality. The Graph price is forming an inverted head and shoulders pattern on the daily chart, which may indicate a bullish reversal. The price is near the 50-day EMA and needs to break above it to confirm the breakout. The volume and market cap of The Graph is increasing, suggesting low volatility and high interest. The Graph price trades at $0.088 with a 2.12% gain.
Technical Levels
- Support Levels: $0.085 and $0.078
- Resistance Levels: $0.09 and $0.10
Disclaimer
The views and opinions stated by the author, or any people named in this article, are for informational purposes only and do not establish financial, investment, or other advice. Investing in or trading crypto or stock comes with a risk of financial loss.
Mr. Pratik chadhokar is an Indian Forex, Cryptocurrencies and Financial Market Advisor and analyst with a background in IT and Financial market Strategist. He specialises in market strategies and technical analysis and has spent over a year as a financial markets contributor and observer. He possesses strong technical analytical skills and is well known for his entertaining and informative analysis of the Financial markets.


