
 Home
Home News
News
- 1 NEAR price is in a narrow congestion zone below the cluster of $1.150.
- 2 NEAR price tried to surpass the upper trendline of the falling channel.
NEAR Protocol is showing the indecisiveness between the bulls and bears and is hovering in the narrow congestion zone for the past sessions. Moreover, the price traded close to the 50-day EMA and sustained above the 20-day EMA. Buyers must surpass the primary hurdle of $ 1.200 to attain further buying momentum. Besides the downtrend, NEAR price has sustained the gains and gave signs of a reversal by making a base formation near $1.050 and a double-bottom pattern.
NEAR price is initiating a reversal and surpassed the 20-day EMA indicating buyers presence in the past sessions. Moreover, the technicals now suggest a significant upside toward the $1.200 level, followed by $1.300, to retest in the upcoming sessions. Moreover, the chart showcased a three-rising soldiers pattern, suggesting that the bulls have rescued the momentum and are ready for bullishness. NEAR protocol has shown signs of rejection during the fall and gave signs of a reversal, a positive sign for the bulls.

At press time, the NEAR price was $1.134 with an intraday gain of 1.25%, showing neutrality on the charts. Moreover, the trading volume increased by 3.25% to $39.25 Million, and the market cap is $690.40. Million. However, the pair of NEAR/BTC is at 0.0000421 BTC. Furthermore, analysts maintained a neutral rating suggesting that the volatility may continue in the upcoming sessions.
Will NEAR Protocol Price Surpass $1.200?
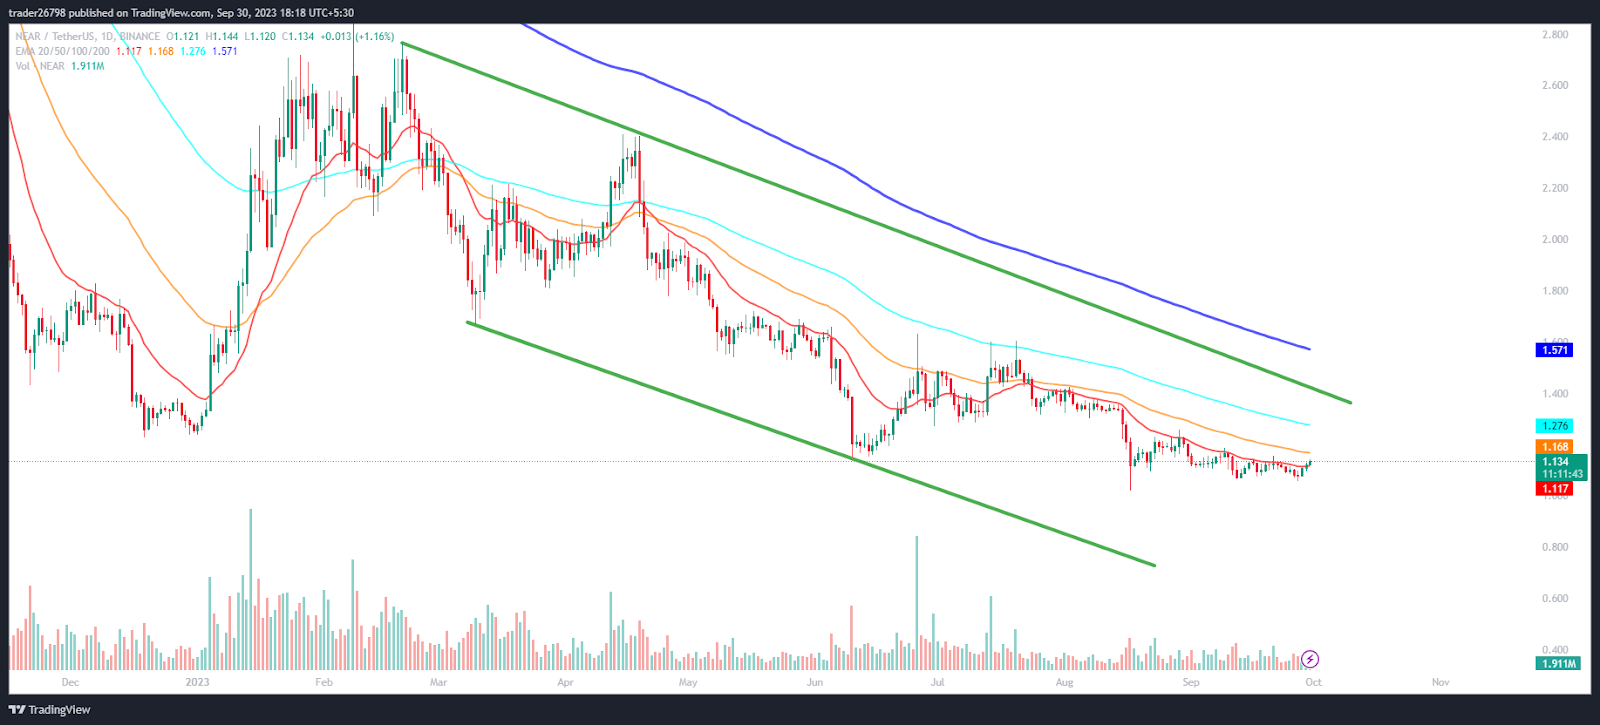
On the daily charts, the NEAR protocol price is in a narrow range and has surpassed the 20-day EMA, highlighting buying pressure. Moreover, the NEAR price has exited the 23.6% Fib zone and is heading for the 38.2% Fib zone.
Will NEAR Protocol Price Surpass 200 Day EMA Hurdle?
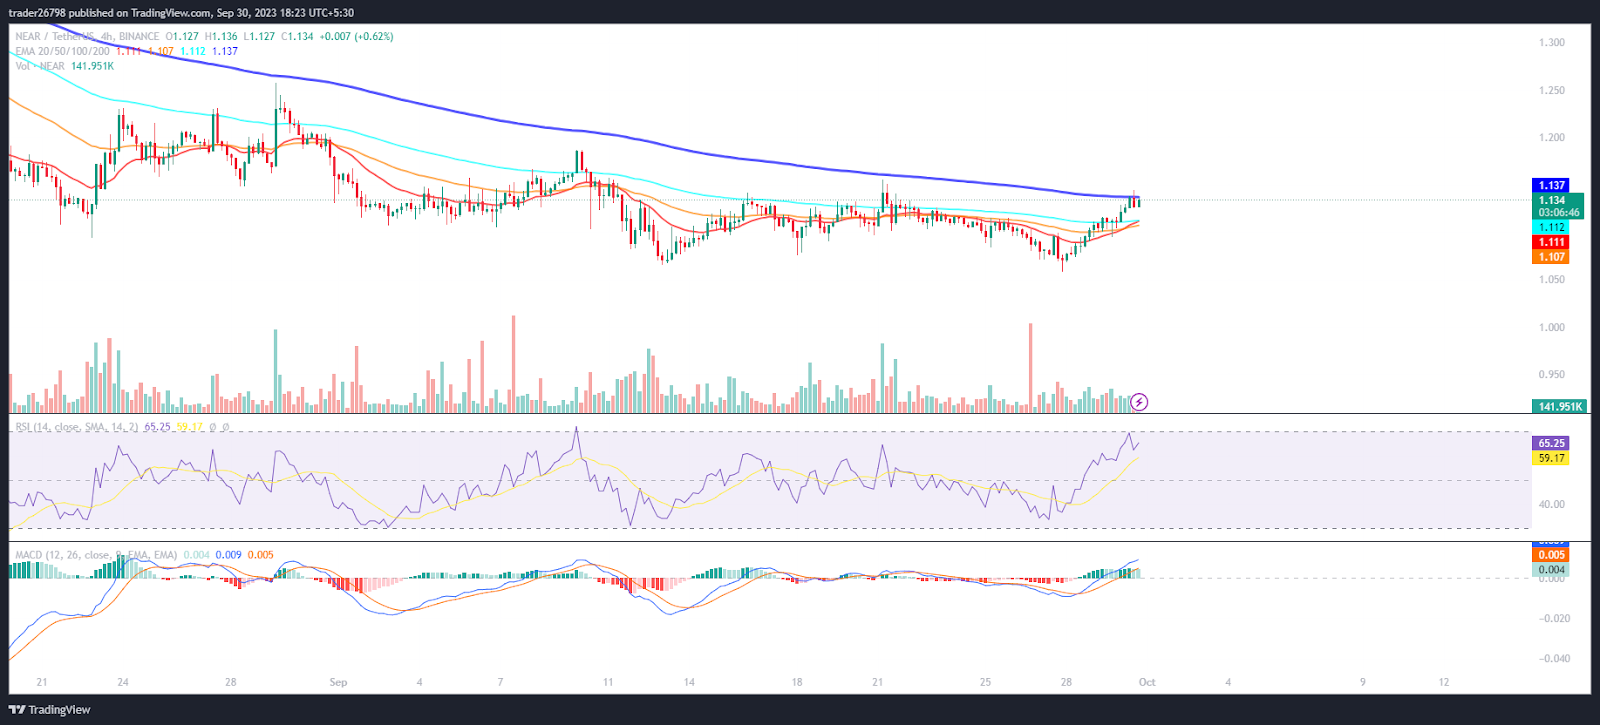
On the 4-hour charts, NEAR protocol price action showcases buyers looking to surpass the 200-day EMA, indicating a reversal from the base near $1.000. Moreover, the chart replicated a strong bounce and witnessed a double bottom pattern and that the price is close to the trendline of $1.150 which is a make-or-break level, leading to a rise in momentum. if reversed from there, it would lead to a retest of the $1.000 level.
The RSI curve stayed in the overbought zone and showed a bullish divergence, indicating buyers’ accumulation in the past sessions.
The MACD shows a bullish crossover amid green bars on the histogram, suggesting a positive outlook for the upcoming sessions.
Summary
NEAR Protocol price is close to the 50-day EMA at a make-or-break level, where buyers are trying to win the ongoing battle and look to defeat the overwhelmed bears. Furthermore, the chart showcased a reversal. Buyers have persisted in making long build-ups, suggesting a positive outlook for the following sessions.
Technical Levels
Support Levels: $1.050 and $1.00
Resistance Levels: $1.200 and $1.500
Disclaimer
The views and opinions stated by the author or any other person named in this article are for informational purposes only and do not constitute financial, investment, or other advice. Investing in or trading crypto or stocks comes with a risk of financial loss.

Nancy J. Allen is a crypto enthusiast, with a major in macroeconomics and minor in business statistics. She believes that cryptocurrencies inspire people to be their own banks, and step aside from traditional monetary exchange systems. She is also intrigued by blockchain technology and its functioning. She frequently researches, and posts content on the top altcoins, their theoretical working principles and technical price predictions.


