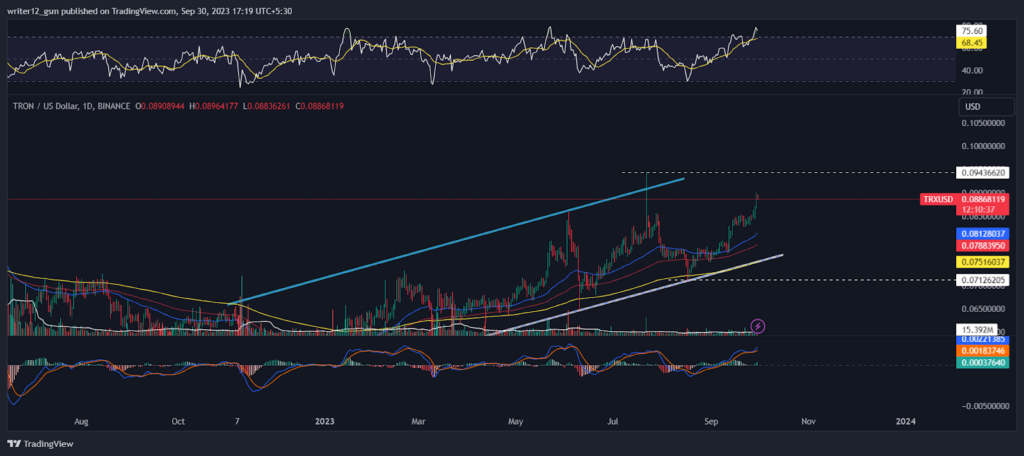
- 1 TRX crypto chart shows bullish momentum by making higher high structures.
- 2 TRON crypto price is above the key moving averages showing bullishness on the chart.
The TRX crypto is in an upward trend after escaping the bear’s grip. The price is trading above the key EMA level on the daily timeframe. The volume is decreasing slightly, suggesting a drop in buying and selling activity.
If the price gets support from the buyers at the current level, it could rise by 0.07% near the price of $0.08872. The nearest support level for the TRX token is around $0.08129127. The price movements are relatively more stable for TRX crypto than other major cryptocurrencies. The buyers have a good chance of reaching the expected target if they can keep the price above the 50 and 200 EMAs, which would favor the bulls.
Tron price has been in a bullish trend for the past few months. After breaking out, TRX crypto price has been supported by the bulls from the trendline. Looking at the historical price action, it can be seen that the 50 EMA level has been a critical demand zone.
Technical Analysis of Tron Crypto Price in 1-D Timeframe

Presently, Tron crypto (USD: TRX) is trading above the 50 and 200-day EMAs (exponential moving averages), which are supporting the price momentum.
Nevertheless, if buying volume counts up, then the price might support bullish momentum by making higher highs and new highs. Hence, the Tron crypto price is expected to move upwards giving bullish views over the daily time frame chart.
The MACD curve at 0.00223622 and the signal curve at 0.00184193 are beyond the zero line. A bearish crossover is observed in the MACD indicator which signals weakness in the momentum of the TRX crypto price. The current value of the RSI curve is 77.49 points. The 14 SMA is above the median line at 68.59 points which indicates that the Tron crypto is bullish.
Summary
Tron crypto (USD: TRX) is heading upwards, making the higher highs structure. TRX crypto price is trading above the 20, 50, 100, and 200 day moving averagegs showing bullishness on the charts. If the price breaks the threshold of $0.09436620, an upward rally might be seen in the stock price. The MACD, RSI, and EMAs are indicating bullishness in the stock price. However, investors and traders should wait for proper setup for the next move and avoid FOMO.
Technical Levels
- Support Levels: $0.08126939 and $0.07126205.
- Resistance Levels: $0.09436620 and $0.10500000.
Disclaimer
This article is for informational purposes only and does not provide any financial, investment, or other advice. The author or any people mentioned in this article are not responsible for any financial loss that may occur from investing in or trading. Please do your own research before making any financial decisions
Steve Anderson is an Australian crypto enthusiast. He is a specialist in management and trading for over 5 years. Steve has worked as a crypto trader, he loves learning about decentralisation, understanding the true potential of the blockchain.


 Home
Home News
News


