
 Home
Home News
News
- 1 SOFI stock price fell 7.74% in September 2023.
- 2 SoFi Technologies’ stock price faced rejection from $9.00 and dropped below the 50-day EMA.
- 3 SOFI stock price struggles to defend the 200-day EMA support.
SOFI stock price fell 7.74% in the previous month and formed a bearish pattern. It faced rejection from $9.00 and began to decline by forming lower lows candles. SoFi Technologies’ stock price is inside the correction phase and bears continuing their dominance on the higher levels.
SOFI share price dropped below the 50-day EMA showcasing that the short-term trend has reversed down. Moreover, the sellers are now trying to pull the price below the 200-day EMA to trigger more sell-offs.

However, the stock has respected the support and showed a minor bounce. It indicates that buyers are trying to defend the support to keep the confidence of investors.
SOFI stock price has eroded the previous gains and has returned to a breakout level. Any short-term up moves facing rejection indicate sellers are more active as compared to buyers. Therefore, the correction might continue for the October month and the $6.50 support level is at risk.
SoFi Technologies stock price closed the previous session at $7.99 with an intraday rise of 2.83%. The market capitalization has also declined and currently stands at 7.59 Billion.
SOFI Stock Price Formed Head and Shoulder Pattern
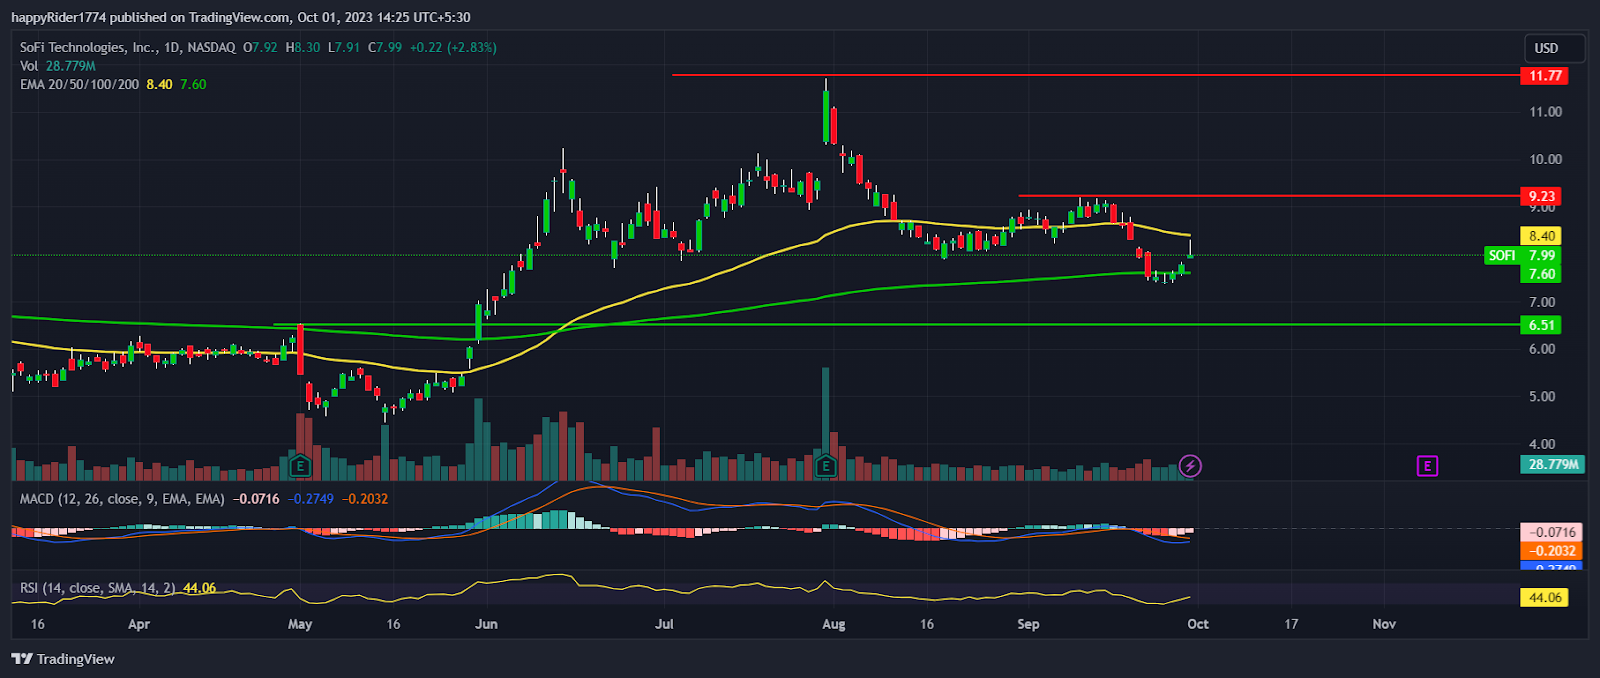
SOFI stock price formed a bearish head and shoulder pattern. It indicates more sell-off may come from the stock which raised concern for long-term investors.
Till SoFi stock price trades below $9.23, it is expected to remain in the bears’ grip. However, if the situation improves and buyers succeed in breaking the $9.23 hurdle. Then we may see a short-term bullish trend reversal.
The price pattern of the stock is bearish so the probability of more downfall is high. The analysis suggests that the upmove in SoFi Technologies shares is temporary and the price may trade with a bearish bias in October.
SoFi Technologies Stock Negatively Impacted by Fall in Indices
SoFi Technologies’ stock price fell 16% in the 3rd week of September and displayed a giant bearish candle. In the previous week, buyers eventually defended the $7.00 support but the up move lacked genuine buying.
Meanwhile, the Nasdaq Composite index and many tech stocks are under selling pressure. So, it is negatively impacting the SOFI stock.
The MACD curve is below the zero line and the histogram bar is red. It indicates that sellers are active and the price may continue to trade with a bearish bias.
Conclusion
SOFI stock price fell 7.74% in the previous month and continues to erode its market capitalization. The technical analysis of the SoFi Technologies stock suggests that the price may decline further and may test $6.00 in October.
Technical levels
- Resistance levels: $9.23 and $11.77
- Support levels: $7.00 and $6.51
Disclaimer
The views and opinions stated by the author, or any people named in this article, are for informational purposes only. They do not establish financial, investment, or other advice. Investing in or trading crypto assets comes with a risk of financial loss.

Nancy J. Allen is a crypto enthusiast, with a major in macroeconomics and minor in business statistics. She believes that cryptocurrencies inspire people to be their own banks, and step aside from traditional monetary exchange systems. She is also intrigued by blockchain technology and its functioning. She frequently researches, and posts content on the top altcoins, their theoretical working principles and technical price predictions.


