
 Home
Home News
News
- 1 Aave price prediction showcases the recovery of AAVE crypto through an interesting rising pattern.
- 2 AAVE crypto has recovered above 20, 50, 100 and 200-days daily moving averages.
- 3 Aave cryptocurrency gained around 33.03% year to date.
Aave price prediction indicates the recovery of AAVE crypto through an interesting recovery pattern over the daily chart. However, sellers are currently trying to pull AAVE crypto down towards the lower trendline of the pattern. AAVE crypto price has been niclining through an ascending parallel channel over the daily time frame chart. At present, sellers’ are getting involved in the trade to drag AAVE crypto price towards the lower trendline. However, buyers need to accumulate to push AAVE for its recovery.
Aave price was at $69.12 and lost 0.06% of its market capitalization during the day trading session. Trading volume has declined by 17.04% during the intraday trading session. This demonstrates that sellers are still present in the trade and pull AAVE down. Volume to market cap ratio was at 7.15%.
Will AAVE Price Maintain In The Pattern?
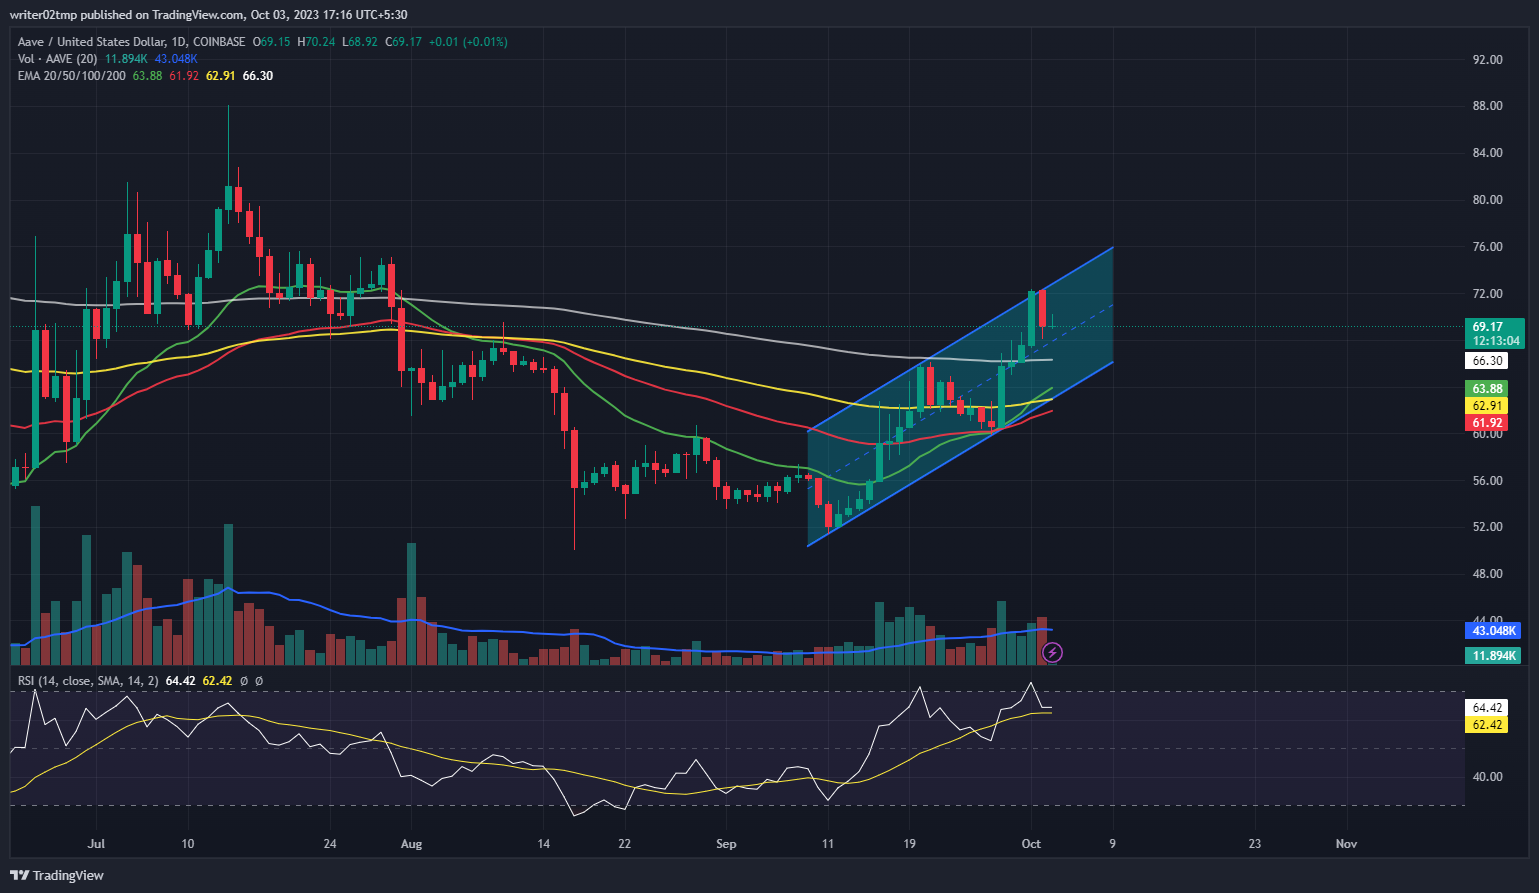
Aave price prediction showcases the recovery of AAVE in an ascending parallel channel pattern over the daily time frame chart. Meanwhile, AAVE tried to break out of the rising pattern but sellers pulled AAVE down and are still trying to drag AAVE crypto towards the lower trendline. However, volume change can be seen below average and needs to grow in favor of buyers during the intraday trading session. Meanwhile, AAVE crypto has recovered above 20, 50, 100 and 200-days daily moving average.
AAVE price has displayed mixed performance over different time frames. In the past week, it recorded a significant increase of approximately 10.84%. Over the course of the last month, AAVE saw a substantial incline, with a gain of 25.08%.
However, extending the time frame beyond a month, AAVE experienced a drop of approximately 10.44% over the past three months, and the decline extended to 11.85% over the last six months. Nevertheless, when considering the year-to-date performance, the price of AAVE has shown a notable gain of 33.03%. These fluctuations suggest varying trends in AAVE’s price over different time periods.
Technical indicators highlight the downtrend on the AAVE cryptocurrency chart. Relative strength index confirms the struggle of AAVE crypto in gaining a strong upside trend.
RSI was at 63 and is getting back from the overbought territory. Investors in Aave cryptocurrency need to wait until AAVE crypto price reaches the upper trendline of the ascending parallel channel.
Summary
Aave price prediction indicates the recovery of AAVE crypto through an interesting recovery pattern over the daily chart. However, volume change is below average and needs to grow in favor of buyers intraday. Nevertheless, when considering the year-to-date performance, the price of AAVE has shown a notable gain of 33.03%. Technical indicators highlight the downtrend on the AAVE cryptocurrency chart.
Technical Levels
Support Levels: $67.85 and $66.15
Resistance Levels: $72.13 and $74.55
Disclaimer
The views and opinions stated by the author, or any people named in this article, are for informational purposes only, and they do not establish financial, investment, or other advice. Investing in or trading crypto or stock comes with a risk of financial loss.

Adarsh Singh is a true connoisseur of Defi and Blockchain technologies, who left his job at a “Big 4” multinational finance firm to pursue crypto and NFT trading full-time. He has a strong background in finance, with MBA from a prestigious B-school. He delves deep into these innovative fields, unraveling their intricacies. Uncovering hidden gems, be it coins, tokens or NFTs, is his expertise. NFTs drive deep interest for him, and his creative analysis of NFTs opens up engaging narratives. He strives to bring decentralized digital assets accessible to the masses.


