
 Home
Home News
News

- 1 VRSK stock price fell below the 50-day EMA, which highlights the selling pressure.
- 2 Buyers are losing strength and are trying to hold the channel lows of $240.
Verisk Analytics (VRSK stock) VRSK stock price was traded in the rising channel and persisted in stretching the gains for the past sessions. Amid the uptrend, VRSK stock has split the channel’s lower trendline of $240 and shows signs of reversal. However, post breakdown, VRSK stock forms a hammer candlestick, showing the buyer’s efforts to regain the trajectory and is closed flat in yesterday’s market session. Moreover, instead of follow on selling, VRSK stock has stopped the selloff and cooled off the selling pressure which was a positive sign.
Verisk Analytics (VRSK stock) VRSK stock price is trading below the 20, 50 and 100-day EMA, but above the 200-day EMA indicates that sellers are looking aggressive and have persisted in smashing the ongoing clusters decisively and are heading to split the 200-day EMA in the upcoming sessions,

However, buyers need to hold the region that will protect the 200-day EMA mark. The lower trajectory of VRSK stock is near $210 and $200, the demand zone, whereas the upper trajectory is near $260 and $270, which is a strong resistance zone. Additionally, per the options chain, at the strike price of $240, it favors the bulls due to the open interest of 298 hundred shares on the put side, which was trapped, and the mighty bulls will try to retain $240 to prevent their long positions.
At the press time, VRSK stock price is trading at $236.35 with an intraday gain of 0.05%. it closed flat in yesterday’s session. However, the trading volume remained at an average of 694.899K, and the market cap is $34.277 Billion. However, analysts have maintained a neutral rating with a yearly target price of $251.19.
Verisk Analytics, Inc. engages in the provision of data analytics services. It serves insurance customers and focuses on the prediction of loss, the selection and pricing of risk, and compliance. The company was founded in 1971 and is headquartered in Jersey City, NJ.
Will VRSK Stock Retain $240 Or Retest 100 Day EMA?
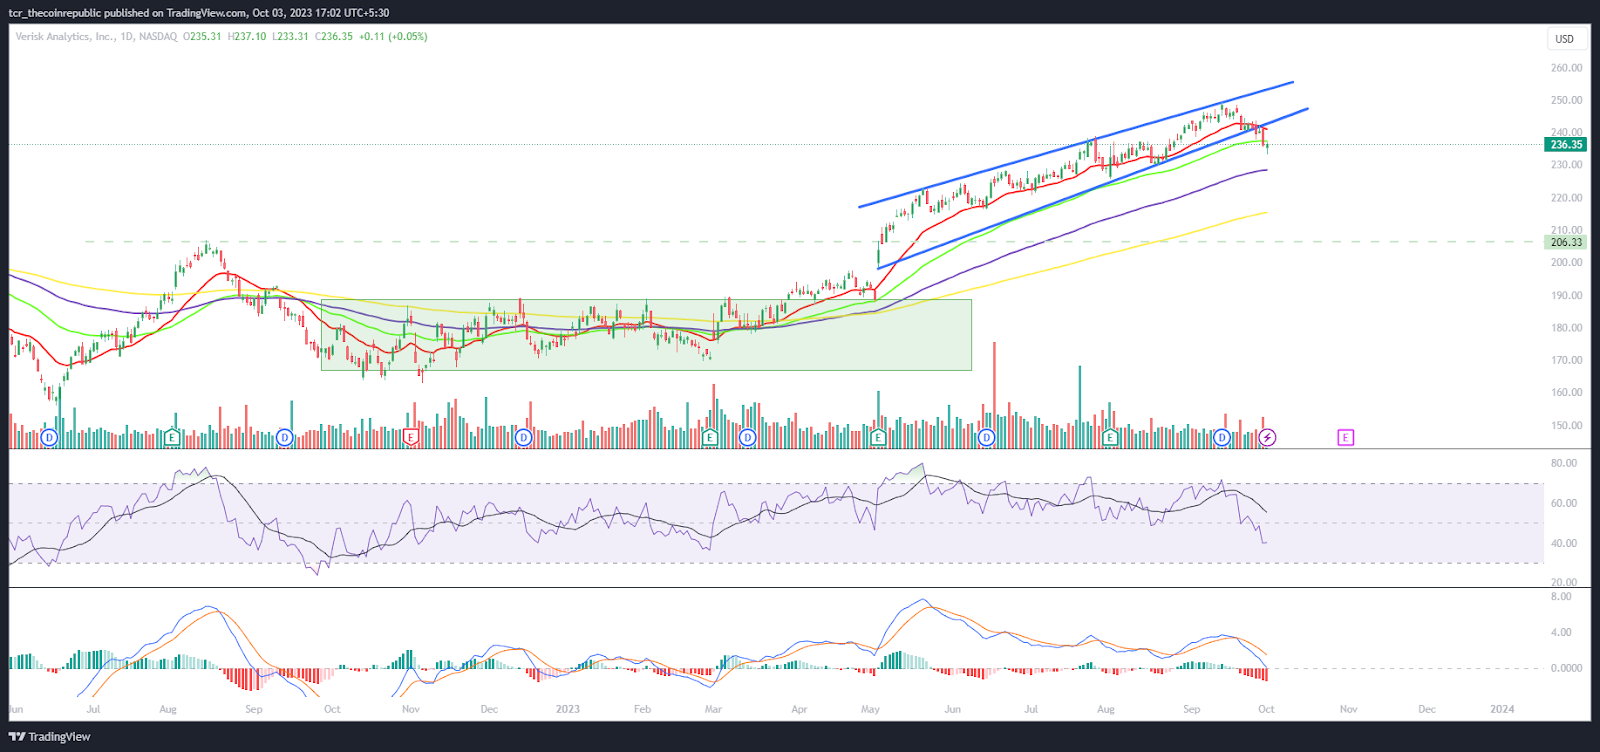
On the daily charts, VRSK stock price is trading in an uptrend and has maintained the gains amid the channel breakdown. However, buyers need solid momentum to overcome the bearishness and retain $240 to trap the bears; otherwise, it would lead to a reversal and may retest the 100-day EMA spot.
The RSI curve slips below neutrality and is heading to the oversold region, showing a negative crossover on the charts.The MACD shows a bearish crossover and red bars on the histogram, suggesting a negative outlook for the upcoming sessions.
Summary
VRSK stock price is trading close to the lower trendline of $240, which has been under selling pressure. Moreover, the sellers want to extend the selloff to retest the 100-day EMA spot. Furthermore, the chart shows that a correction is due, and the channel breakdown signals the upcoming disaster.
Technical Levels
Support Levels: $230 and $210
Resistance Levels: $250 and $260
Disclaimer
The views and opinions stated by the author or any other person named in this article are for informational purposes only and do not constitute financial, investment, or other advice. Investing in or trading crypto or stocks comes with a risk of financial loss.

Adarsh Singh is a true connoisseur of Defi and Blockchain technologies, who left his job at a “Big 4” multinational finance firm to pursue crypto and NFT trading full-time. He has a strong background in finance, with MBA from a prestigious B-school. He delves deep into these innovative fields, unraveling their intricacies. Uncovering hidden gems, be it coins, tokens or NFTs, is his expertise. NFTs drive deep interest for him, and his creative analysis of NFTs opens up engaging narratives. He strives to bring decentralized digital assets accessible to the masses.


