
 Home
Home News
News
- 1 WFC stock price slumped nearly 3.06% intraday on Monday, October 2nd.
- 2 WFC stock price slipped below the key exponential moving average of 50-day.
- 3 The analysts offering a 1-year price forecast for WFC share price estimate a maximum potential of 64.10% to the upside.
Wells Fargo & Company (NYSE: WFC) stock price slumped nearly 3% intraday on Monday. Monday’s fall witnessed the breakdown of the immediate support level at $40 showing signs of weakness. The overall chaos in the global economy might be one of the factors behind the price decline.
The daily chart illustrates that the stock price bottomed out in the 1st week of May 2023 soon after the dividends and made a bullish rally that lasted till the end of July 2023. The stock price made a surge of almost 25% in the timespan.

Recently, the stock price slipped below the 200-day EMA after a selloff from the upper levels. Moreover, the WFC stock price made a failed attempt to break above the key EMAs of 50-day and 200-day. The failure added more sellers and the stock experienced a breakdown of the recent support.
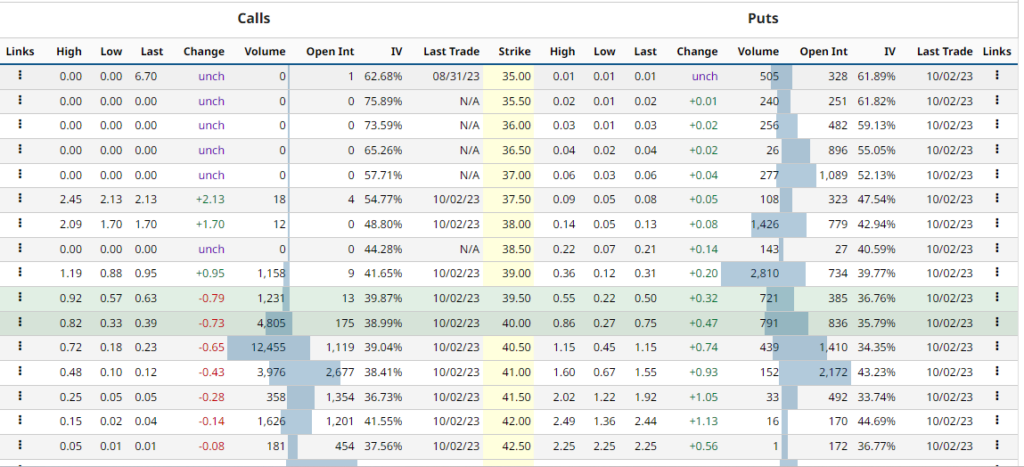
WFC stock option-chain analysis shows that the current implied volatility in the market is 34.58% with an increment of 3.14% in the last trading session. The at-the-money strike has an OI of 721 on the PUT side and 1231 on the CALL side indicating that bears are slightly dominating at the CMP.
WFC Stock Price Showed Weakness Over the Daily Chart
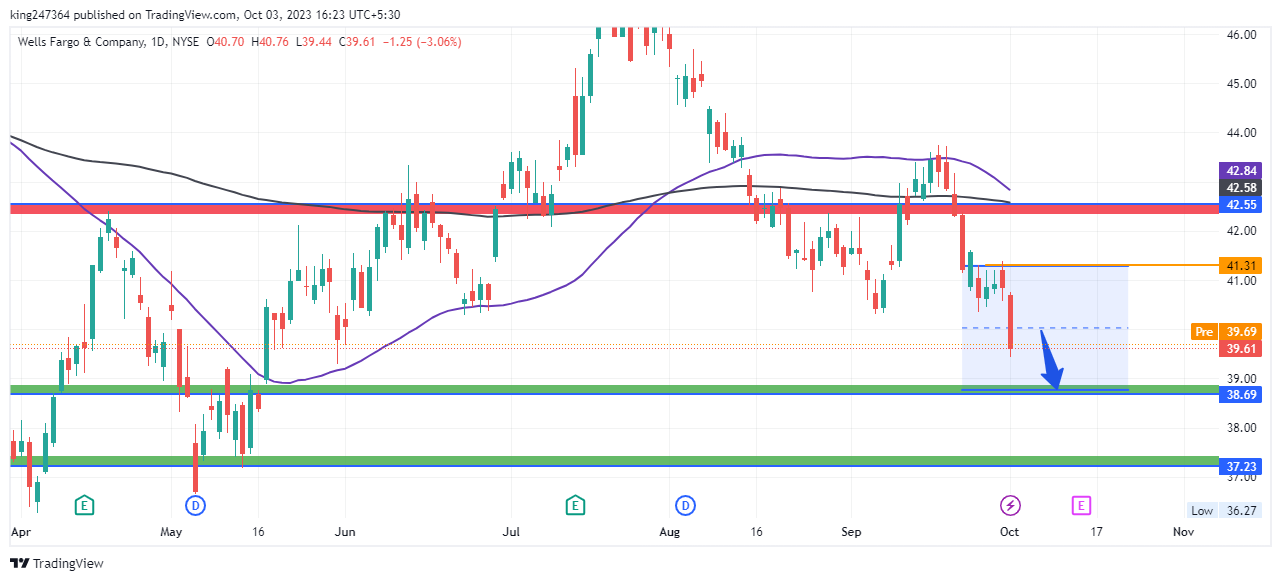
The WFC stock price is currently at $39.16 and has witnessed a breakdown to slide below the $40 level on Monday. The price might continue with the momentum on Tuesday’s session and try to test the next support level.
Analysts offering a 1-year price forecast for Wells Fargo & Company have given a maximum estimate of $65 with an upside potential of more than 64.10% and a minimum estimate of $43.
Technical Indicators Show Weakness Over the Chart
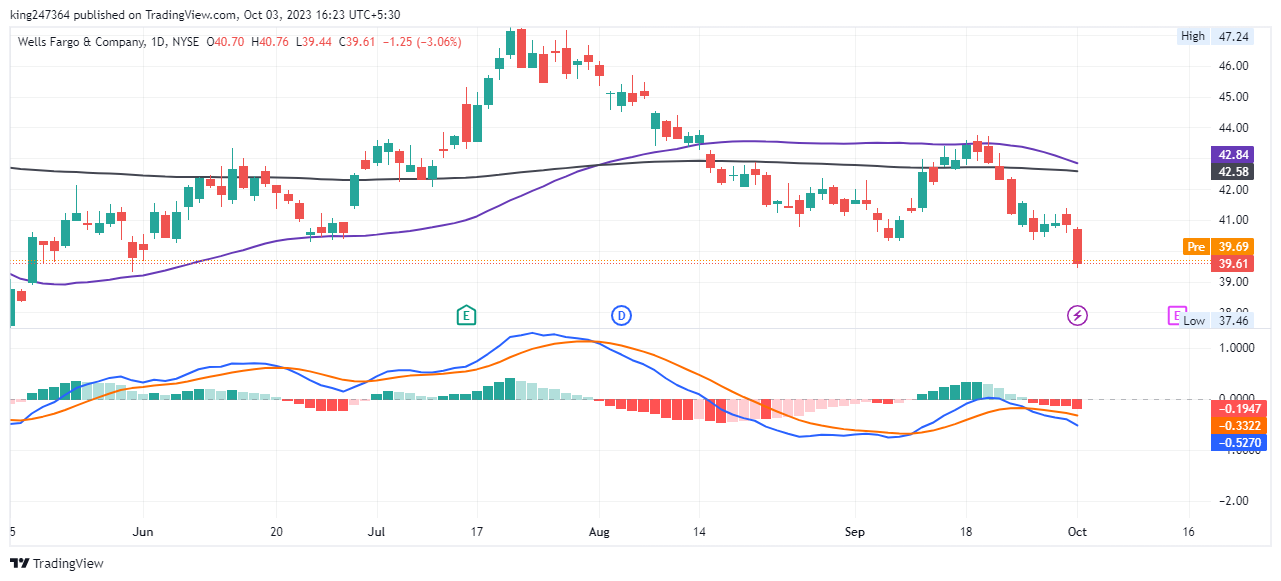
The daily WFC stock price chart shows that the price slipped below the key moving averages of the 50-day and 200-day EMAs. The EMAs have turned out to be a dynamic resistance for the price.
The overall technical opinion rating, including RSI and MACD indicators, signals a 40% “sell” with an average short-term outlook on maintaining the current direction.
Conclusion
Wells Fargo stock price slumped nearly 3% in intraday on Monday, breaking down the immediate support level at $40. The decline might be due to the overall chaos in the global economy. The stock price made a bullish rally from May to July 2023. Recently, it slipped below the 200-day EMA and failed to break above the key EMAs of 50-day and 200-day.
The breakdown of the recent support might continue in Tuesday’s session and test the next support level. Analysts offer a 1-year price forecast of $65 to $43, with an upside potential of more than 64.10%.
Technical Levels
- Support levels: $38.69 and $37.23
- Resistance levels: $41.31 and $42.55
Disclaimer
The views and opinions stated by the author, or any people named in this article, are for informational purposes only and do not establish financial, investment, or other advice. Investing in or trading crypto or stock comes with a risk of financial loss.
Steve Anderson is an Australian crypto enthusiast. He is a specialist in management and trading for over 5 years. Steve has worked as a crypto trader, he loves learning about decentralisation, understanding the true potential of the blockchain.


