
 Home
Home News
News

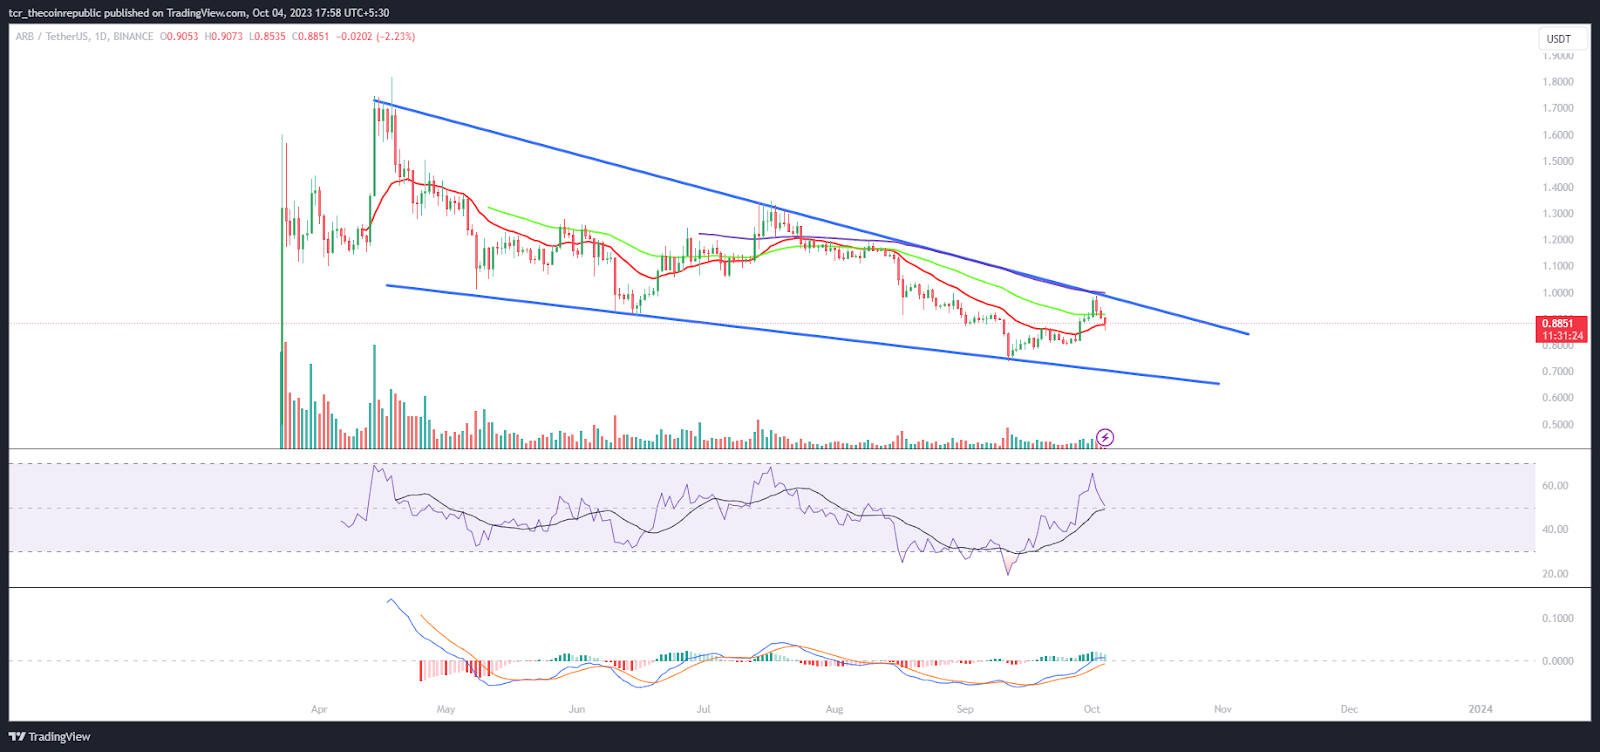
- 1 ARB token price showcased a falling wedge pattern on the charts.
- 2 Buyers are retaining the momentum and are looking to extend the gains beyond $0.8900.
Arbitrum (ARB) token price is trading close to the 20-day EMA and near the mid-Bollinger band, indicating neutrality on the charts. Moreover, the price action shows that the ARB token retested the support zone of $0.750. However, the ARB price is close to the barrier of the 50-day EMA, near $0.8900, which must be surpassed to stretch the buying momentum. Buying interest has also been witnessed in the past sessions, where investors have made fresh long positions and are looking for a reversal. Furthermore, the chart shows the falling wedge, where the upper trendline is near $0.9000, which, if broken, it would lead to a breakout toward $1.000.

Arbitrum (ARB) token price is in a downtrend, forming lower lows. Recently, the trend was flipped. Furthermore, during the recovery, bulls did not stretch the reversal and were rejected from the 200-day EMA near the upper trendline swing of $0.9000. However, the bulls did not let back much, took support on the 20-day EMA, and tried for a pullback to retest the barrier.

At the press time, the ARB token price is trading at $0.8845 with an intraday drop of 2.31%, showing profit booking in yesterday’s session. Moreover, the trading volume increased by 2.87% to $154.13 Million, and the pair of ARB/BTC is at 0.0000320 BTC. However, the market cap of the ARB token is $1.13 Billion. Furthermore, analysts have maintained a neutral rating and suggest that ARB will recover the gains soon.
Will ARB Token Attain Fresh Buying Momentum?
On the daily charts, the ARB token price is close to the breakout region and is near the neutral region. Moreover, the ARB token price signals fresh buying interest developed in the past sessions and signs of reversal from the support zone of $0.8500. Furthermore, the ARB token supported the 38.2% Fib zone and is close to the 50% zone.
The RSI curve stayed in the overbought zone and formed a bullish divergence, indicating the reversal cues.
The MACD indicator shows a bullish crossover and green bars on the histogram suggesting a positive outlook for the upcoming sessions.
Summary
Arbitrum (ARB) token price stayed near the neutral region and showed signs of reversal in the past sessions. Moreover, the price action shows buyers have attained momentum and are looking to surpass the trendline of $0.9000 above the 50-day EMA.
Technical Levels
Support Levels: $0.8700 and $0.8500
Resistance Levels: $0.9000 and $0.9300
Disclaimer
The views and opinions stated by the author or any other person named in this article are for informational purposes only and do not constitute financial, investment, or other advice. Investing in or trading crypto or stocks comes with a risk of financial loss.
Steve Anderson is an Australian crypto enthusiast. He is a specialist in management and trading for over 5 years. Steve has worked as a crypto trader, he loves learning about decentralisation, understanding the true potential of the blockchain.


