
 Home
Home News
News
- 1 BARC stock price is between the price range of price range of 166.70 GBX and 141.82 GBX.
- 2 Barclays stock price is trying to breach key moving averages.
BARC stock price has the potential to break the level of 166 GBX as it has some pros. As per Simply Wall Street Barclays stock is trading at 42.5% below the estimated fair value and its revenue is forecasted to grow by 4.99% per year. The earnings of the company have grown by 31.8% per year over the last 5 years and it is trading at a good valuation as compared to its peers.
BARC price forecast indicates sellers and buyers don’t have a proper grasp on the trend. Investors and traders might prefer to wait for a proper setup in order to decide the direction of the trend. Barclays stock price currently taking support at the 50 EMA level.
In order to reach the level of 166 GBX stock needs buyers to start stepping into the price action with substantial momentum. However, according to the technical indicators and price action, the odds are lining in the bull’s favor as buyers are trying hard to breach the key moving averages.
Nevertheless, BARC stock price has declined around 2.19% in a week but gained 3.32% in a month. Also, the Barclays share price gained around 4.65% in the previous 3 months and 4.19% over the last six months. However, the BARC stock declined by 2.97% year to date. The above data shows the prolonged consolidation phase of stock.
Will BARC Stock Price Break Consolidation and Reach the Level of 166 GBX?
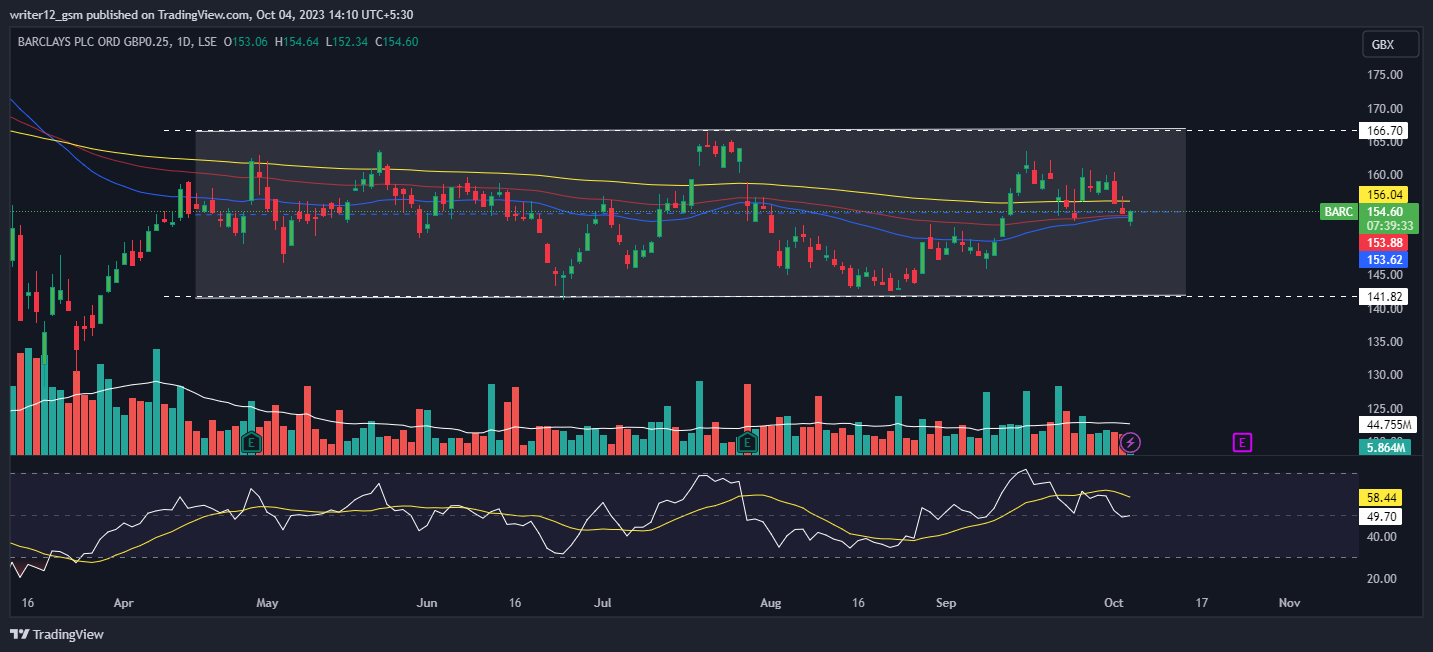
BARC stock price must initiate its recovery rally to reach the upper level of the consolidation phase. However, the Barclays stock needs to accumulate buyers in order to surge towards its recovery phase. Meanwhile, the BARC share price has slipped below the 200-day daily moving averages.
Technical indicators suggest the consolidation phase of the Barclays stock price. Relative strength index (RSI) showcases the sideways momentum of BARC shares. RSI was at 50.50 and is in a sideways track.
MACD is currently trading at 1.4300 and the signal line is at 1.9253. A bearish cross is seen in the MACD showcasing weakness in the current trend.
Conclusion
BARC stock price needs to attract more buyers to surge towards the upper trendline of the consolidation phase over the daily time frame chart. Meanwhile, the BARC share price is trying to gather support and surge towards 20, 50, 100, and 200-day daily moving averages. BARC shares have been consolidating inside the horizontal price range of $166.70 and $141.82. Investors in Barclays stock must watch the daily time frame chart for any directional changes. However, investors and traders should wait for proper setup for the next move and avoid FOMO.
Technical Levels
- Support Levels:151.56 GBX and 141.80 GBX.
- Resistance Levels: 166.70 GBX and 161.00 GBX.
Disclaimer
This article is for informational purposes only and does not provide any financial, investment, or other advice. The author or any people mentioned in this article are not responsible for any financial loss that may occur from investing in or trading. Please do your own research before making any financial decisions

Nancy J. Allen is a crypto enthusiast, with a major in macroeconomics and minor in business statistics. She believes that cryptocurrencies inspire people to be their own banks, and step aside from traditional monetary exchange systems. She is also intrigued by blockchain technology and its functioning. She frequently researches, and posts content on the top altcoins, their theoretical working principles and technical price predictions.


