
 Home
Home News
News
- 1 AVAX coin price surpassed the 20-day and 50-day EMAs, showing a reversal in the past sessions.
- 2 Buyers are gaining traction and are looking to beat the bears.
Avalanche (AVAX) coin price showed a reversal, flipped the downtrend from the demand zone of $8, showing buyer accumulation in the past trading sessions. Moreover, the price action shows that buying interest is developing with fresh reversal cues. Furthermore, the chart structure highlights the trendline breakout. AVAX is gaining momentum to retain the bullishness. However, the AVAX coin price is near the primary hurdle of $11, close to the 100-day EMA, which must be surpassed to extend the buying momentum. If bulls succeed in escaping the zone, it will extend the reversal to $14 in the upcoming sessions.
Avalanche (AVAX) coin price was in a downtrend post breakdown of the ascending triangle pattern and persisted in dragging the gains amid a bearish market. Moreover, the chart favors the bears and does not favor a rebound. However, due to the short covering, AVAX attained fresh buying momentum and crashed the cluster of $10, which trapped the short positions. Moreover, the AVAX price took support on the 38.2% Fib zone and showed a reversal.
At press time, the AVAX coin price was trading at $10.20 with an intraday gain of 4.79%, showing buying momentum in yesterday’s market session. Moreover, the trading volume increased by 5.89% to $221.31 Million, and the pair of AVAX/BTC was at 0.000368 BTC. However, the market cap of AVAX is $3.62 Billion. Furthermore, analysts have maintained a neutral rating and suggest a reversal based on the technical setup for the upcoming sessions.
Will AVAX Price Escape 100 Day EMA?
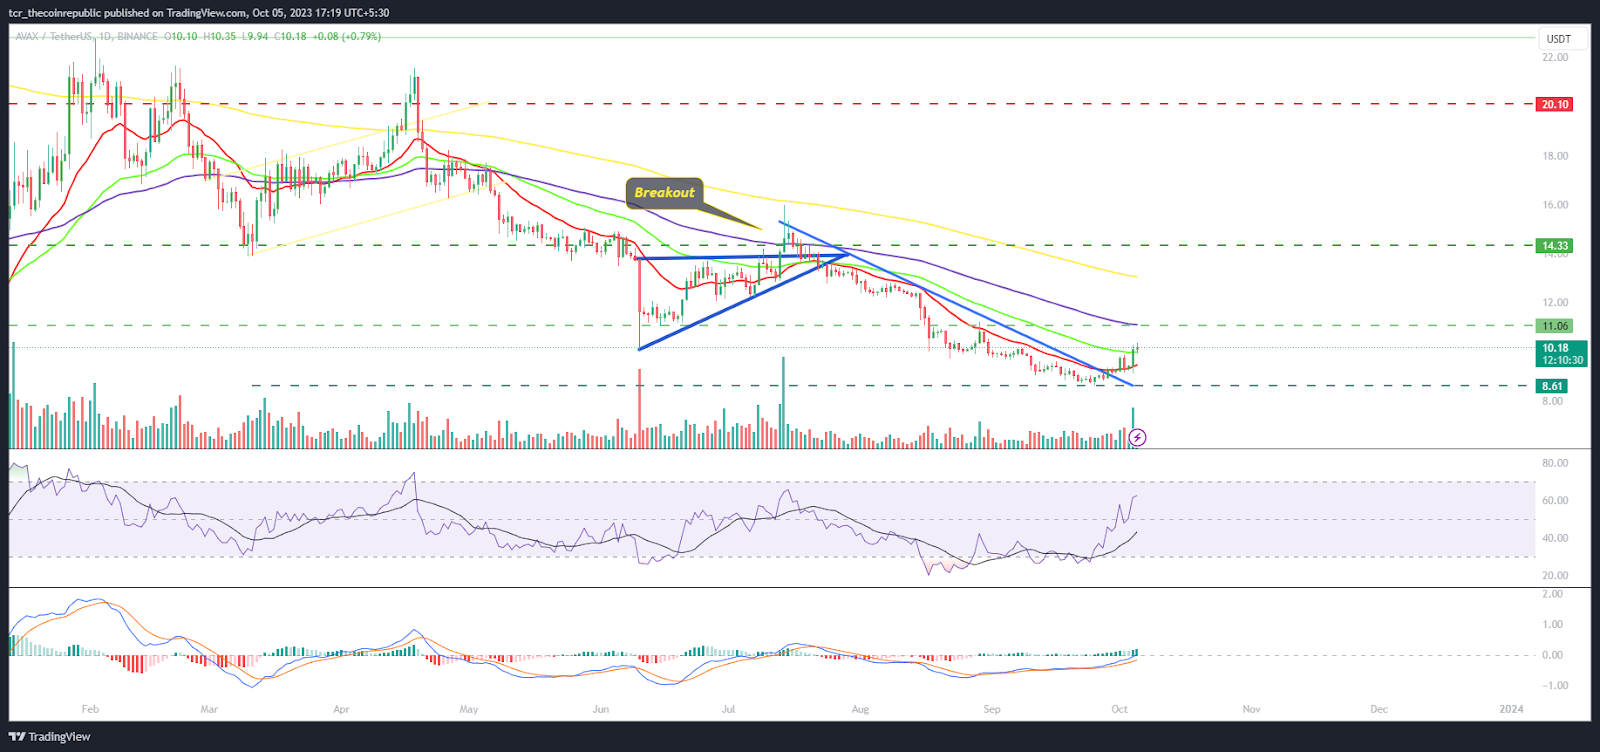
On the daily charts, AVAX price is above the 50-day EMA and shows a reversal from the demand zone of $8.00. Furthermore, the price action shows that short positions were trapped. The short covering moves signal the bulls’ comeback. However, bulls must surpass the 100 and 200-day EMAs to extend the buying momentum. Moreover, bulls held the lower territory instead of a further downtrend and attempted a reversal.
The RSI curve was in the overbought zone and showed a bullish divergence, indicating that buyers have retained the strength and are gaining traction.The MACD indicator shows a bullish crossover and green bars on the histogram, suggesting a positive outlook for the upcoming sessions.
Summary
Avalanche (AVAX) coin price was in a downtrend and has flipped the trend from the demand zone of $8.00. It is now heading for the crucial resistance of $12. Furthermore, the chart also signals a fresh bull move and the start of a rally. Buyers have persisted in accumulating the coin and hungry for something big.
Technical Levels
Support Levels: $8 and $5
Resistance Levels: $12 and $15
Disclaimer
The views and opinions stated by the author or any other person named in this article are for informational purposes only and do not constitute financial, investment, or other advice. Investing in or trading crypto or stocks comes with a risk of financial loss.
Mr. Pratik chadhokar is an Indian Forex, Cryptocurrencies and Financial Market Advisor and analyst with a background in IT and Financial market Strategist. He specialises in market strategies and technical analysis and has spent over a year as a financial markets contributor and observer. He possesses strong technical analytical skills and is well known for his entertaining and informative analysis of the Financial markets.


