
 Home
Home News
News
- 1 DFS stock price is under selling pressure.
- 2 Buyers failed to surpass the 20-day EMA hurdle indicating bearishness.
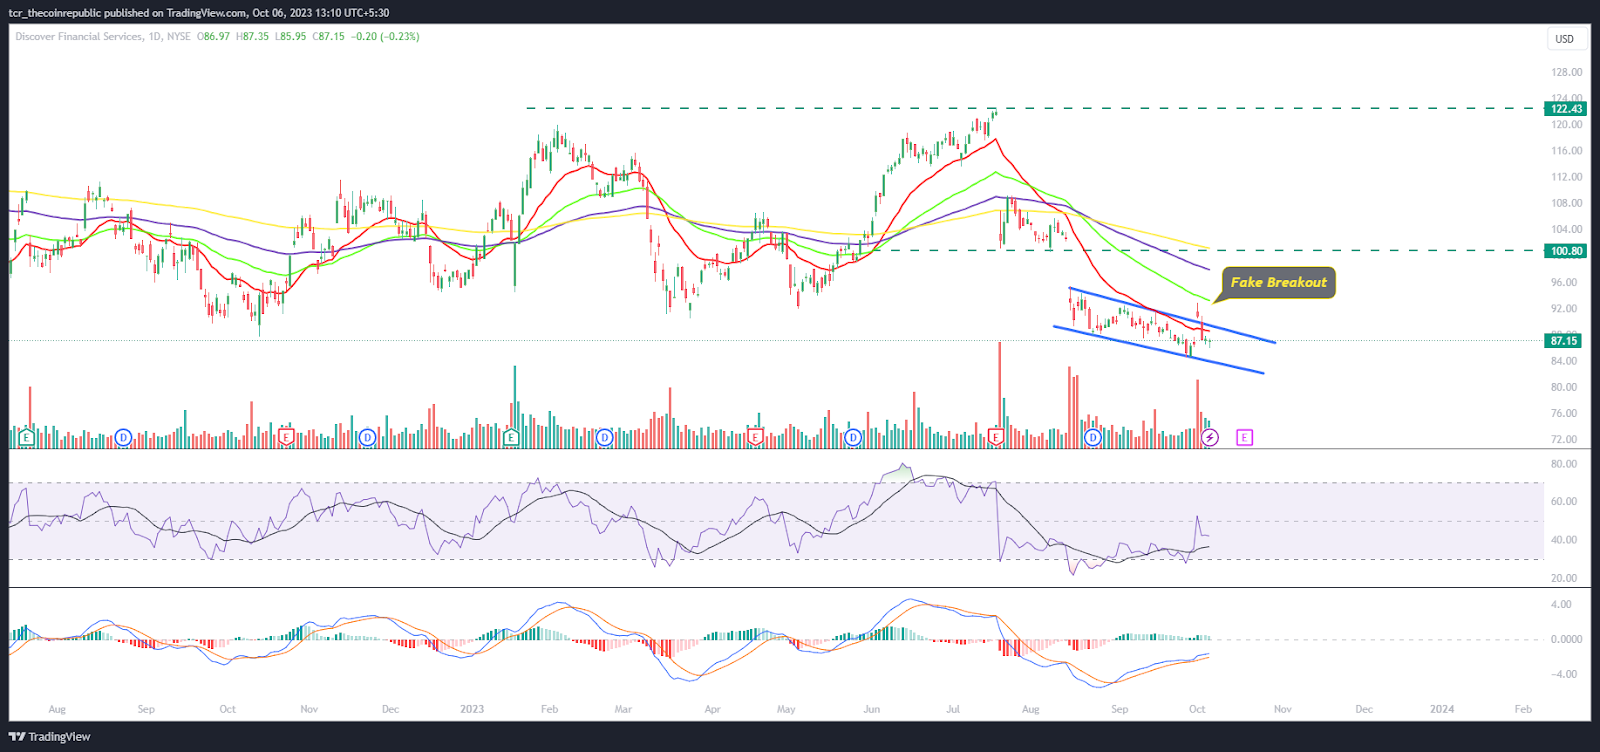
Discover Financial Services (DFS stock) price is in the lower trajectory swing near $85 and is facing selling pressure. Moreover, DFS stock is losing gains inside the falling parallel channel. Recently, a fake breakout near the channel highs at $90 was witnessed, which the bulls failed to surpass; follow-on selling was noted on the charts. Furthermore, the price action shows the seller dominance and has persisted in adding short positions, resulting in slippages. DFS stock has broken the round mark of $100.
DFS share is in a downtrend – chart shows a gap-down and follow-on selling price action. Moreover, the bulls look weak, and the bears continued to dominate the battle amid the bearish market sentiments. Furthermore, the options chain shows that, at the strike price of $85, a massive open interest of 1322 hundred shares on the put side shows a strong support zone, whereas, at the strike price of $89, an open interest of 663 hundred shares on the put side shows resistance zone.

At press time, DFS share price was $87.15 with an intraday drop of 0.23%, showing neutrality on the charts. Moreover, the trading volume increased by 0.55% to 2.889 Million; market cap is $21.783 Billion. However, analysts maintained a buy rating with a yearly target price of $111.63, which suggests a strong growth outlook for the upcoming sessions.
Discover Financial Services is a holding company. It operates under the Digital Banking and Payment Services segments. The Digital Banking segment focuses on consumer banking and lending products, specifically Discover-branded credit cards issued to individuals on the Discover Network and other consumer banking products and services, including private student loans, personal loans, home loans, and deposit products.
Will DFS Stock Fill the Gap Near $100?
On the daily charts, DFS stock price is close to the demand zone of $80 and has shown decent put writing there, suggesting that buyers are preparing for a bounce to fill the gap near $100. In the downtrend, a rebound to retest the 200-day EMA is imminent.
The RSI curve is near neutrality and shows a bullish divergence, forming a positive crossover, suggesting a significant upside toward $100.3The MACD shows a bullish crossover and green bars on the histogram, suggesting a positive outlook for the upcoming sessions.
Summary
DFS stock price is close to the channel upper trendline and is looking to surpass the territory highs of $90 to reach $100. Furthermore, the price action shows that buyers did not let back amid the fake breakout witnessed in the past sessions. Moreover, the buying interest persists which is shown on the charts, which might lead to a bounce toward $100 in the upcoming sessions.
Technical Levels
Support Levels: $85 and $80
Resistance Levels: $90 and $100
Disclaimer
The views and opinions stated by the author or any other person named in this article are for informational purposes only and do not constitute financial, investment, or other advice. Investing in or trading crypto or stocks comes with a risk of financial loss.

Adarsh Singh is a true connoisseur of Defi and Blockchain technologies, who left his job at a “Big 4” multinational finance firm to pursue crypto and NFT trading full-time. He has a strong background in finance, with MBA from a prestigious B-school. He delves deep into these innovative fields, unraveling their intricacies. Uncovering hidden gems, be it coins, tokens or NFTs, is his expertise. NFTs drive deep interest for him, and his creative analysis of NFTs opens up engaging narratives. He strives to bring decentralized digital assets accessible to the masses.


