
 Home
Home News
News

- 1 Bitcoin price (BTC) currently trades at $27,699.
- 2 The daily chart shows that Bitcoin price experienced a breakout of the 50-day and 200-day EMA.
- 3 The BTC price chart illustrates the formation of an ascending parallel channel pattern over the daily timeframe.
Bitcoin and other cryptocurrencies are outperforming the rest of the global markets which are in decline. Bitcoin price illustrates a positive outlook above the 50-day and 200-day EMA. Currently, the crypto price shows an accumulation near the recent swing that may potentially lead to a breakout. The daily chart illustrates the formation of an ascending parallel channel pattern.

The Bitcoin price trend analysis states that the crypto price bounced from the $25000 level turning the short-term trend optimistic. The overall crypto market has been optimistic in the recent sessions and so is the case with the market leader.
The technical indicators suggest that the Bitcoin price showed a breakout above the 50-day and 200-day EMA indicating bulls’ strength in the short term. Moreover, the price respects an upper trendline resistance which it must surpass to continue the upward momentum.

Bitcoin Price Shows Breakout of Key EMAs
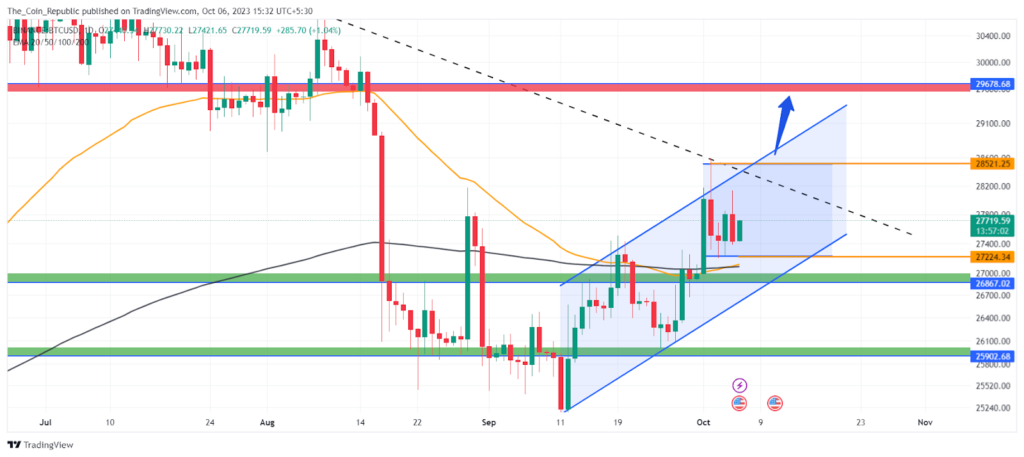
The Bitcoin price currently trades at $27,699 and shows an accumulation near the recent swing. The BTC price has a major hurdle of $28,500 on the upper side which is halting the further surge. The breakout of the accumulation may trigger another rally in BTC that could take the price near $29,700.
The volume analysis shows that BTC crypto received $12.08 Billion in the past 24 hours, which is 18.7% more than the last day. The crypto holds a market cap of $542.05 Billion and ranks first in the crypto market. The volume to market-cap ratio is 2.20% indicating low volatility in the market.
Technical Indicators Show Optimism in the Short-Term
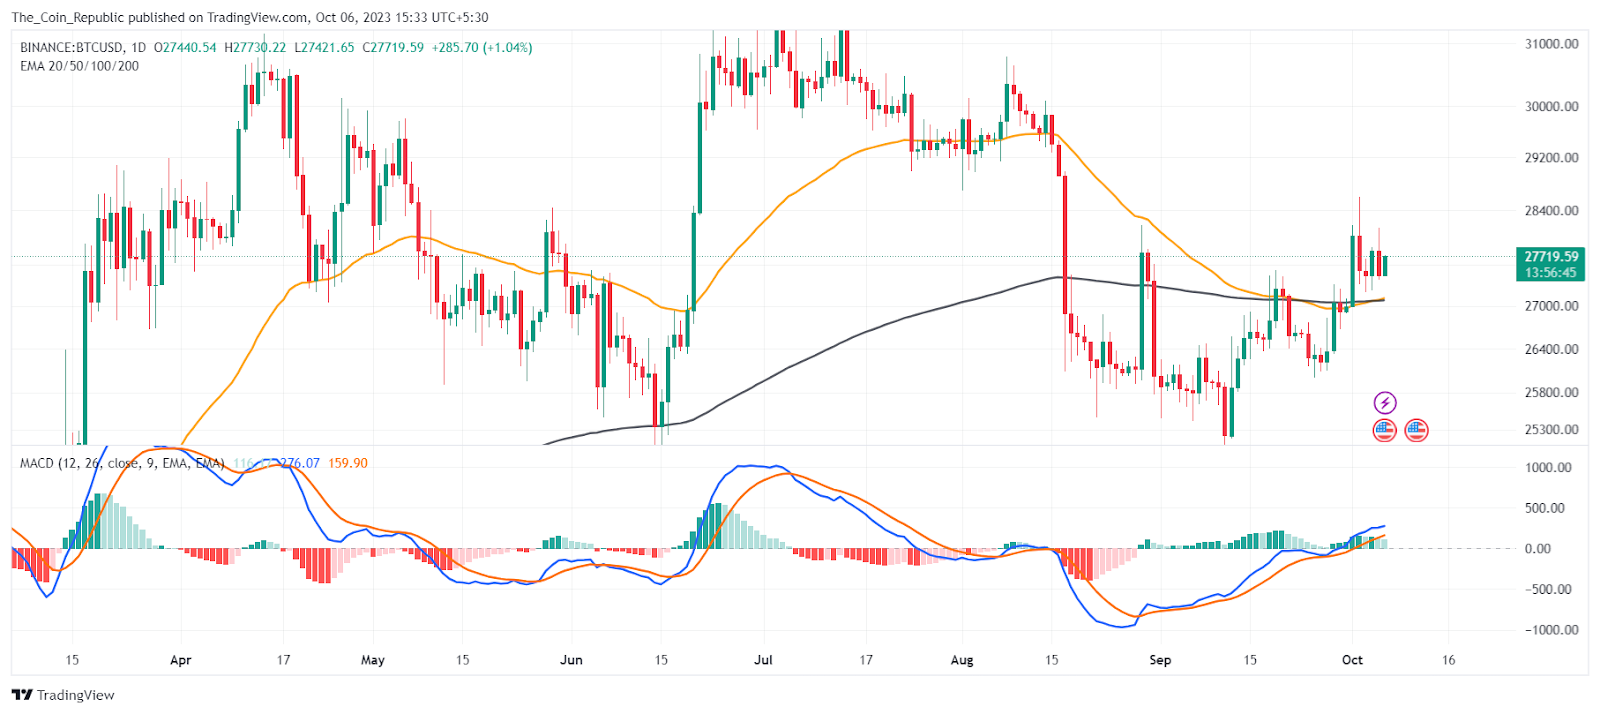
MACD lines are showing a positive crossover. The histogram bars are also being formed above the mean line of decreasing height, indicating neutral to bullish momentum in the crypto.
The EMA analysis shows that the BTC price surged above the 50 and 200-day exponential moving averages indicating the bulls dominating the price trend.
Conclusion
Bitcoin and other cryptocurrencies are doing well while the global markets are falling. Bitcoin price is above the 50-day and 200-day EMA and shows a positive outlook. The price is in an ascending parallel channel pattern and may break out soon. The price faces a major resistance at $28,500 and a major support at $25,000. The volume-to-market-cap ratio is low, indicating low volatility. The market cap of Bitcoin is $542.05 Billion and it ranks 1st in the crypto market.
Technical Levels
- Support Levels: $26,867 and $25,902.
- Resistance Levels: $28,511 and $29,678.
Disclaimer
The views and opinions stated by the author, or any people named in this article, are for informational purposes only and do not establish financial, investment, or other advice. Investing in or trading crypto or stock comes with a risk of financial loss.
Steve Anderson is an Australian crypto enthusiast. He is a specialist in management and trading for over 5 years. Steve has worked as a crypto trader, he loves learning about decentralisation, understanding the true potential of the blockchain.


