
 Home
Home News
News

- 1 MMM stock price decreased by 5.96% over the past seven days.
- 2 3M stock price is under extreme bearish pressure on the daily chart.
3M stock price is facing strong bearish pressure on the daily technical charts, as it is trading below the 100 and 200-day EMAs. The stock failed to break above its key resistance levels near the EMAs in the past few months, despite several attempts by the buyers.

The stock is currently trading near $88.40, with a marginal gain of 0.65% in the intraday session. The stock has a potential upside target of $100, but it needs to overcome the bearish momentum and surge above the 200-day EMA. The stock has a support level of $85, which could prevent further slide.

MMM stock price prediction suggests that the stock is in the firm grip of the bears and needs to show signs of reversal before confirming a bullish trend.
Technical indicators favor the bears projecting a pessimistic perspective for the buyers. RSI and stochastic RSI oscillator are moving near the overbought zone whereas the major EMA lines are acting as barrier points for MMM price.
The company’s performance has been dismal throughout the year. The returns were -27.25% in the year-to-date period, -13.63% in the last six months, -17.01% in the last month, and -5.96% in the last week. This shows a persistent bearish trend.
Technical Analysis of 3M Stock Price in 1-D Time Frame
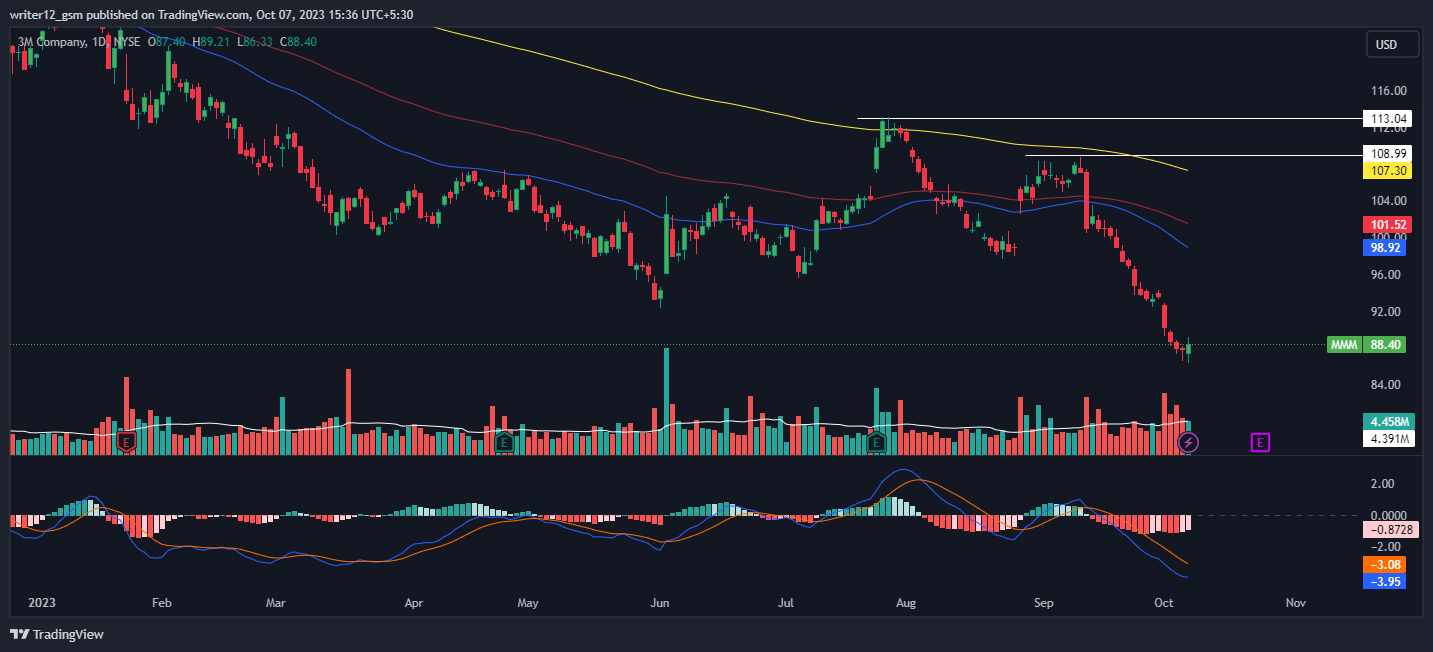
3M stock (NYSE: MMM) is trading under the 50 and 200-day daily moving averages (DMAs), which are not upholding the price trend. The current value of RSI is 22.90 points. The 14 SMA is below the median line at 28.02 points which indicates that the 3M stock is bearish.
The MACD line at -3.95 and the signal line at -3.08 are below the zero line. A bearish crossover is observed in the MACD which signals more bearishness for the MMM stock price.
Weekly-Time Horizon Analysis
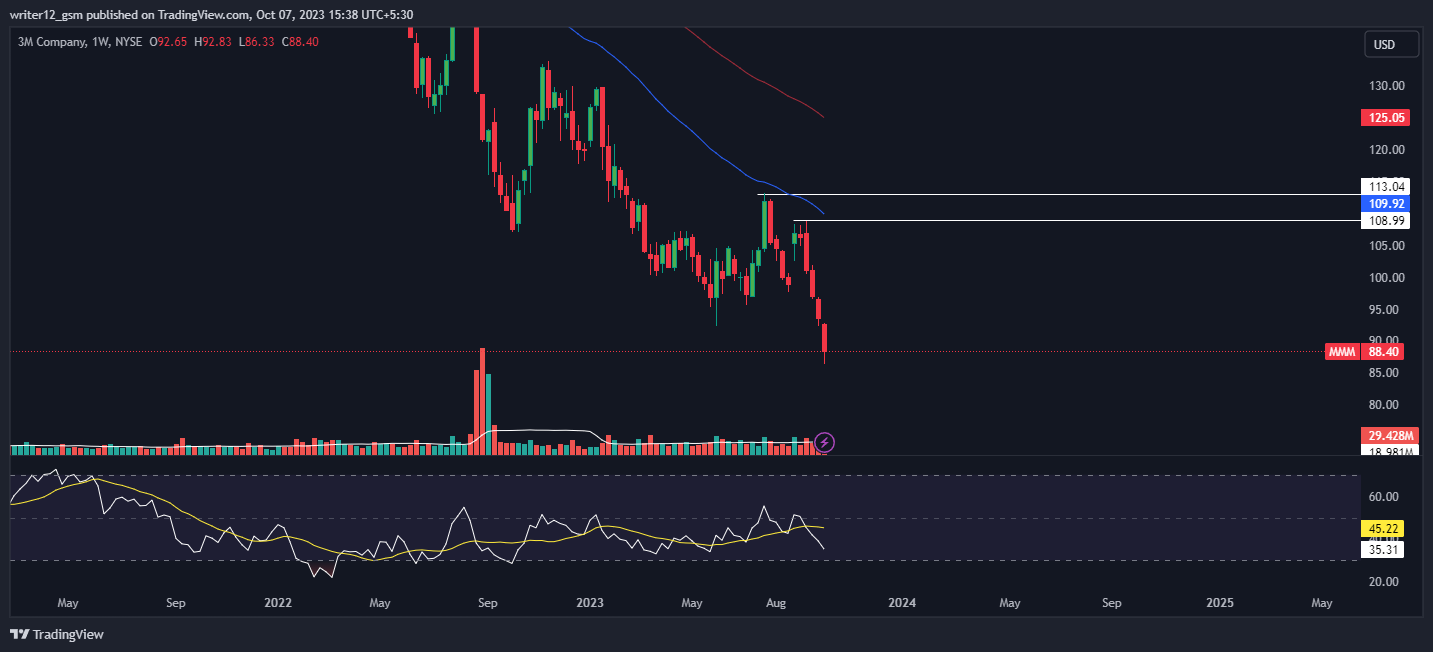
The weekly charts of 3M stock reveal that the sellers have been dominant. The stock has been on a downtrend, as it has broken below the key EMAs. The technical indicators also confirm the bearish sentiment, as the RSI is near the oversold zone at 35 and the MACD has formed red bars and a bearish crossover. These signals indicate that the stock may face more downward pressure in the coming weeks.
Summary
3M (NYSE: MMM) technical oscillators support the bearish trend. The MACD, RSI, and EMAs are emphasizing negative signs and imply that the downtrend may continue in the MMM stock price. 3M price action suggests that the investors and traders are bearish on the 1-day time frame. The price action reflects a bearish perspective at the moment.
Technical Levels
- Support Levels: $85.00 and $80.00
- Resistance Levels: $100.04 and $98.92
Disclaimer
This article is for informational purposes only and does not provide any financial, investment, or other advice. The author or any people mentioned in this article are not responsible for any financial loss that may occur from investing in or trading. Please do your own research before making any financial decisions.
Mr. Pratik chadhokar is an Indian Forex, Cryptocurrencies and Financial Market Advisor and analyst with a background in IT and Financial market Strategist. He specialises in market strategies and technical analysis and has spent over a year as a financial markets contributor and observer. He possesses strong technical analytical skills and is well known for his entertaining and informative analysis of the Financial markets.


