
 Home
Home News
News
- 1 AMC stock price rose by 10.67% this week showing buyers’ presence in the stock.
- 2 AMC Entertainment Holdings is taking support and sustaining above the $8 level.
AMC stock price has been on a downtrend for the past three weeks, as it faced resistance from the higher levels and formed lower lows. This shows that the bears have been in control and the stock has lost momentum. The stock has also broken below the key moving averages, which indicates further weakness.
The technical analysis suggests the AMC stock price is oversold and could bounce back from the lower levels. However, the stock needs to show signs of strength and reversal before confirming a pullback rally.
AMC stock price is in a correction phase, but trading near the crucial support of $8.00. It formed a bullish candle indicating that buyers are active and will try their best to rebound. AMC Entertainment Holdings, Inc. stock price closed the previous session at $8.30 with an intraday drop of 0.48%.
If the buyers succeed in defending the current support, then the possibility of a bounce–back will increase. However, if the sell-off continues and AMC stock drops below lower levels, more downfall is possible.
Buyers tried multiple times to break the higher range and expand upwards. However, due to the strong presence of sellers, prices faced rejection. It shows sellers are still active on higher levels.
Technical Analysis of AMC Stock Price in 1-D Time Frame
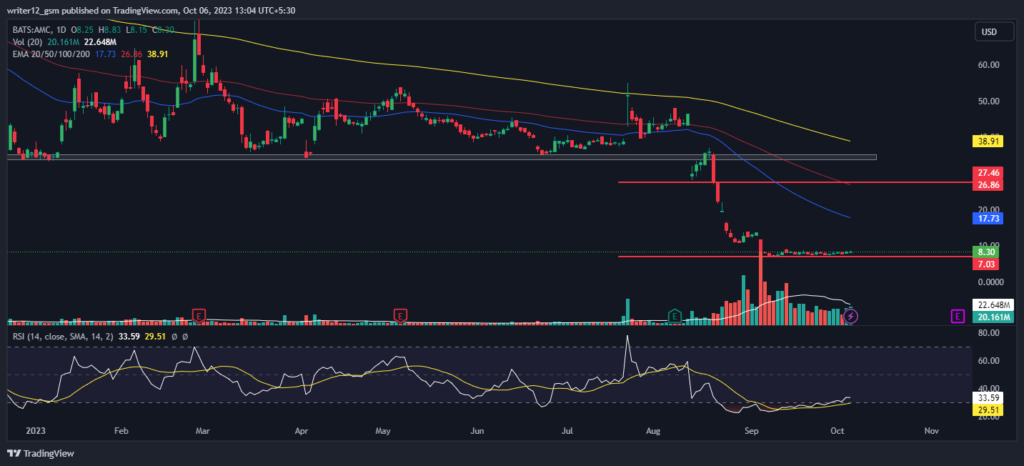
AMC price is below the downward-sloping 50-day and 200-day EMAs showcasing a downtrend. However, the AMC price has gone far away from the EMAs.
The current value of RSI is 33.59 points. The 14 SMA is above the median line at 29.51 points which indicates that the AMC stock is bearish. The MACD generated a positive crossover and the histogram is also green indicating bullishness. However, the MACD curve is still in the negative territory.
Weekly-Time Horizon Analysis
AMC stock price has shown sellers’ strength on the weekly charts. Moreover, the price is below the key EMAs, which shows further weakness in the stock. The RSI curve is near the oversold region at 38. A negative outlook was noted, indicating bearishness in the stock. The MACD persisted to form red bars; a bearish crossover was noted, which signals corrective moves.
Summary
AMC stock technical oscillators support the bearish trend. The MACD, RSI, and EMAs are emphasizing negative signs and imply that the downtrend may continue in the AMC Entertainment Holdings, Inc. stock price. AMC price action suggests that the investors and traders are bearish on the 1-day time frame. The price action reflects a bearish perspective at the moment.
Technical Levels
- Support Levels: $8.00 and $7.00
- Resistance Levels: $10.00 and $15.00
Disclaimer
This article is for informational purposes only and does not provide any financial, investment, or other advice. The author or any people mentioned in this article are not responsible for any financial loss that may occur from investing in or trading. Please do your own research before making any financial decisions.
Mr. Pratik chadhokar is an Indian Forex, Cryptocurrencies and Financial Market Advisor and analyst with a background in IT and Financial market Strategist. He specialises in market strategies and technical analysis and has spent over a year as a financial markets contributor and observer. He possesses strong technical analytical skills and is well known for his entertaining and informative analysis of the Financial markets.


