
 Home
Home News
News
- 1 Exxon Mobil stock price is bearish on the daily chart.
- 2 XOM stock price is below the key moving averages.
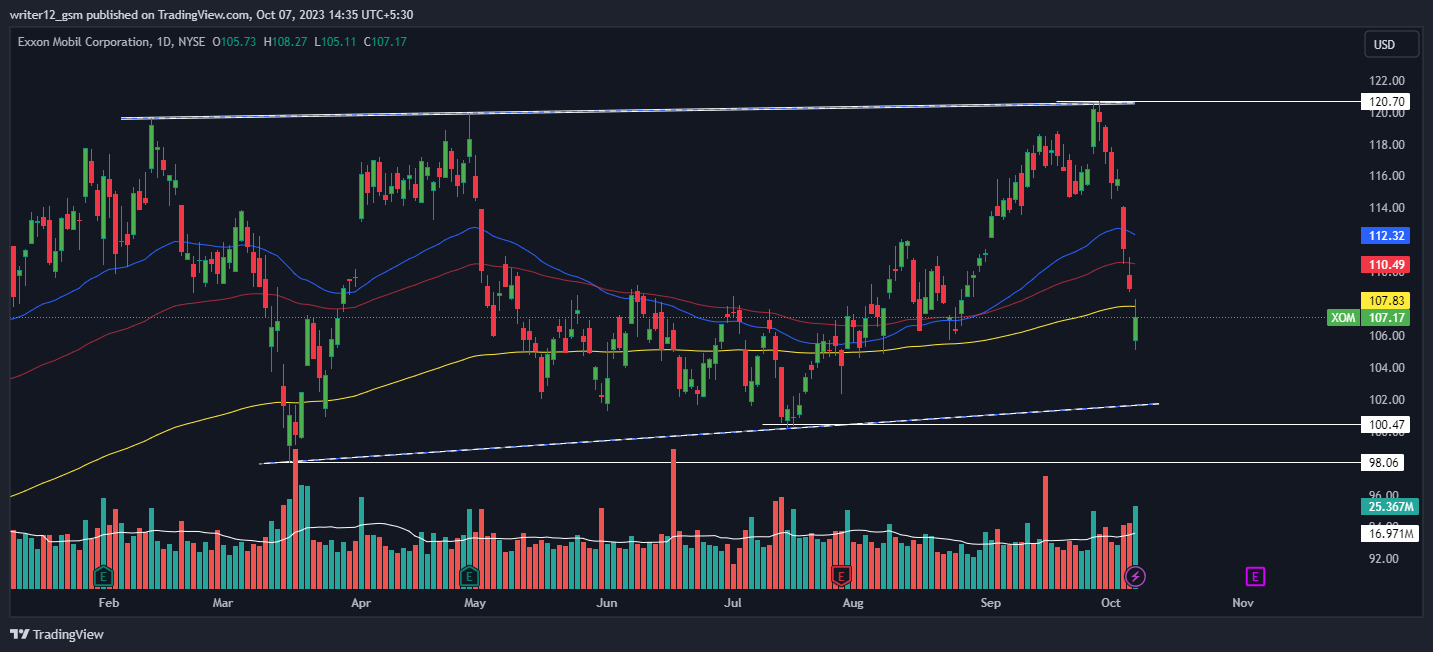
- 2 XOM stock price halted near the value of $120.70, breaking below the key moving averages, showcasing bearishness.
Exxon stock price failed to sustain the high of $120.70 and reversed its direction, resuming the downtrend that indicates further weakness in the market. The market is below the dynamic support trendline, which could lead to more downside. The market is also in a downtrend on a larger time frame, as it is creating lower lows.
Exxon has been falling from its peak levels and forming lower-low structures. It is in a bearish trend after breaking below the 20-day and 200-day moving averages. The bearish pressure could push XOM stock to form a new lower low soon and extend the downtrend.

The current situation requires traders and investors to be patient and wait for a clear signal of a break above or below the range before making any moves. They should also avoid FOMO and minimize losses.
XOM stock price fell 10.02% last week; it declined by 5.56% through the month. Furthermore, XOM stock experienced a drop of roughly 8.29% within the past six months and an increase of 8.84% over the past year.
Additionally, the XOM stock price has slipped by approximately 2.38% year to date. These trends collectively indicate the challenges faced by Exxon stock in their recovery efforts throughout the year.
Technical Analysis: Will Exxon Stock Price Break Below the $100 Mark?
At the moment, Exxon stock (NYSE: XOM) is below the 50 and 200-day simple moving averages (SMAs), which do not support the price trend. If bulls want to make a comeback, they will have to rise and sustain the price above the key EMAs. However, the sellers seem to be more aggressive as compared to buyers.
The current value of RSI is 34.03 points. The 14 SMA is above the median line at 54.18 points which indicates that the XOM stock is bearish.The MACD line was at -0.2208 and the signal line was at 1.14. A bearish crossover is observed in the MACD which signals more bearishness for the XOM stock price.
Analysts Take
There is a mixed opinion among 25 analysts who follow Exxon stock. 10 of them rate Exxon as a ‘Strong Buy,’ while 15 analysts recommend holding the stock, and none of them advise selling it.
XOM stock has an average price target of $124.95, which implies a potential increase of 16.59% from its current price of $107.17. The price targets vary from a high of $150.00 to a low of $110.00.
Summary
Exxon stock price prediction highlights bearishness on the daily chart. The sellers are dominating from the higher levels and the stock is trading below the key moving averages. The MACD, RSI, and EMAs indicate sellers’ presence in the stock. The technical analysis suggests that the XOM stock price is in a bearish grip and the probability of testing the previous highs in the coming months remains low.
Technical Levels
- Support Levels: $100.47 and $98.06.
- Resistance Levels: $110.49 and $112.32.
Disclaimer
This article is for informational purposes only and does not provide any financial, investment, or other advice. The author or any people mentioned in this article are not responsible for any financial loss that may occur from investing in or trading. Please do your own research before making any financial decisions

Andrew is a blockchain developer who developed his interest in cryptocurrencies while pursuing his post-graduation major in blockchain development. He is a keen observer of details and shares his passion for writing, along with coding. His backend knowledge about blockchain helps him give a unique perspective to his writing skills, and a reliable craft at explaining the concepts such as blockchain programming, languages and token minting. He also frequently shares technical details and performance indicators of ICOs and IDOs.


