
 Home
Home News
News
- 1 INTC stock price trades above the major 20, and 50-day daily moving averages.
- 2 Intel Corporation (NASDAQ: INTC) stock’s 52-week price range is around $24.59 – $40.07.
INTC stock has a CMP of $36.19 and an intraday gain of 0.84%. The stock’s average volume for the last 10 days is 38.646 Million and its current volume is 33.262 Million. The INTC stock has a float of 4.186 Billion shares and a market cap of $151.564 Billion.
INTC stock’s dividend yield for the TTM is 2.71% and its last dividend payment was made at 0.13 per share. The last ex-dividend date was August 4th, 2023 and its payout ratio is -543.19% which might be a concern for INTC as it is paying more dividends than it is earning.

INTC stock’s latest quarterly balance sheet for the period ending June 2023 reported total assets of $185.63 Billion and total liabilities of $81.16 Billion. The debt-to-assets ratio is at 43.72%, which is a good sign as it is below moderate which might not be much of a concern.
Furthermore, INTC’s latest quarterly earnings report for the period ending June 2023 displayed a revenue of $12.95 Billion, with a net income of $1.48 Billion, and a gain in profit margin from the last quarter of 11.44%.
This quarter, the INTC reported revenue exceeded analysts’ estimates by $828.576 Million (6.84%). Moreover, the stock reported an EPS of $0.13 for the period ending June 2023, beating the analysts’ estimate of -$0.038 by 443.37%
The next quarter’s EPS is estimated to be $0.215. The next quarter’s revenue is estimated to be $13.5 Billion. The report will be released on October 26th, 2023.
Also, the INTC stock ratings for the stock are neutral and not highly recommended based on 42 analysts who have evaluated the stock in the last three months. The 1-year price forecast for the stock by 33 analysts ranges between $17 to $56.
INTC Stock Price Technical Analysis in 1-D Timeframe
At the time of publishing, the major EMAs in Intel Corporation (NASDAQ: INTC) are bullish. MACD shows a bullish cross on the charts and RSI is at 54 taking support from 14 SMA.
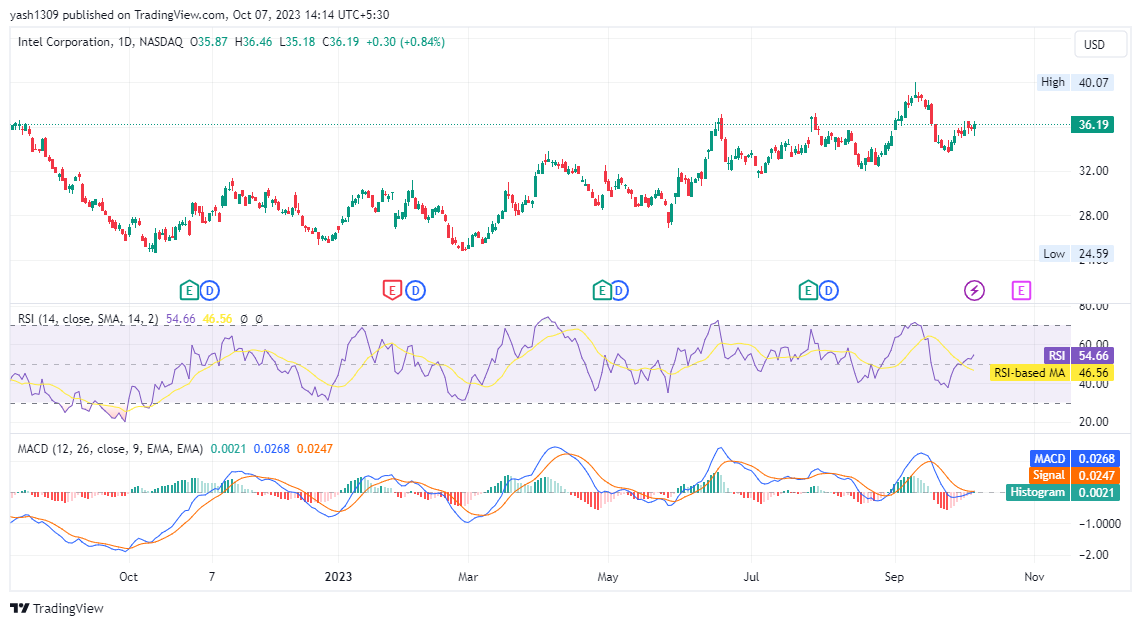
The INTC price surged from $24 on the charts in March 2023 and reached a high of $40. The INTC stock’s journey had some setbacks around earnings and dividends but it overcame and showed wonderful performance in rising upwards.
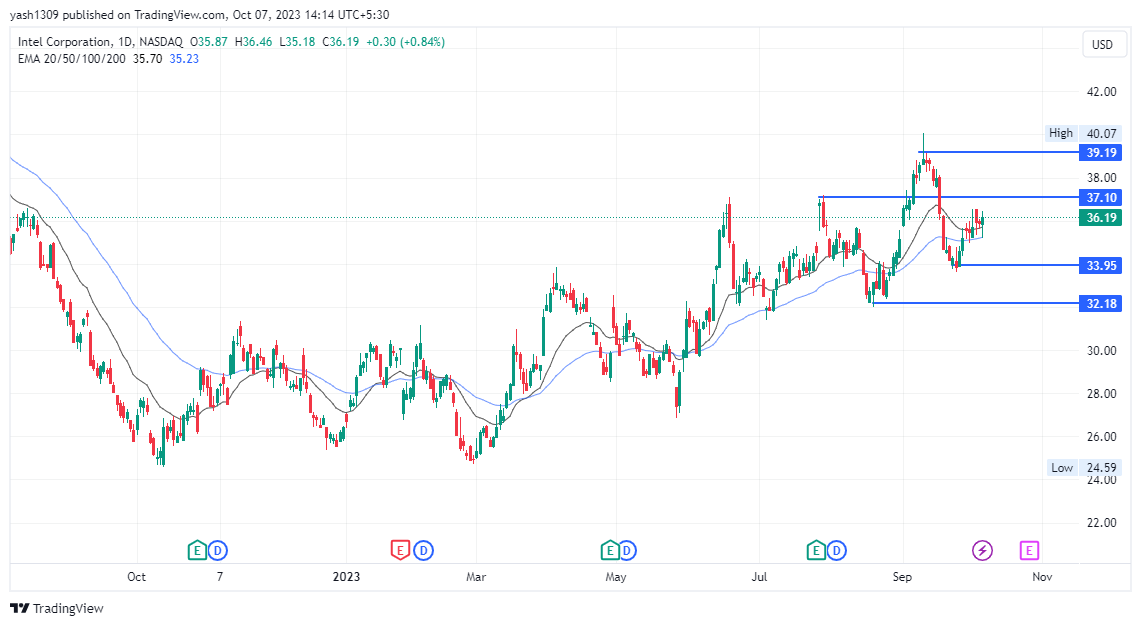
Therefore, if the Intel stock manages to gain strong buying momentum and surges above the swing high, it could trigger a rally and the probable resistance levels are between $37 and $39.
Alternatively, if the stock continues to fall below and breaks below $33 which is the previous swing low, then it could fall up to $32.
Summary
Intel Corporation (NASDAQ: INTC) chart price indicates that the traders and investors of the stock price are bullish and positive on the 1-D time frame. The price action shows a bullish outlook at the time of publishing. The technical analysis tools of Intel stock price such as EMA, RSI, and MACD highlight upward signals and also support bullishness.
Technical Levels
Support Levels: $33 and $32
Resistance Levels: $37 and $39
Disclaimer
In this article, the views and opinions stated by the author, or any people named are for informational purposes only, and they don’t establish the investment, financial, or any other advice. Trading or investing in cryptocurrency assets comes with a risk of financial loss.

Adarsh Singh is a true connoisseur of Defi and Blockchain technologies, who left his job at a “Big 4” multinational finance firm to pursue crypto and NFT trading full-time. He has a strong background in finance, with MBA from a prestigious B-school. He delves deep into these innovative fields, unraveling their intricacies. Uncovering hidden gems, be it coins, tokens or NFTs, is his expertise. NFTs drive deep interest for him, and his creative analysis of NFTs opens up engaging narratives. He strives to bring decentralized digital assets accessible to the masses.


