
 Home
Home News
News
- 1 LYFT stock price is bullish; could break above the 50 and 100 EMAs.
- 2 LYFT stock price rose by 8.90% in the last trading session.
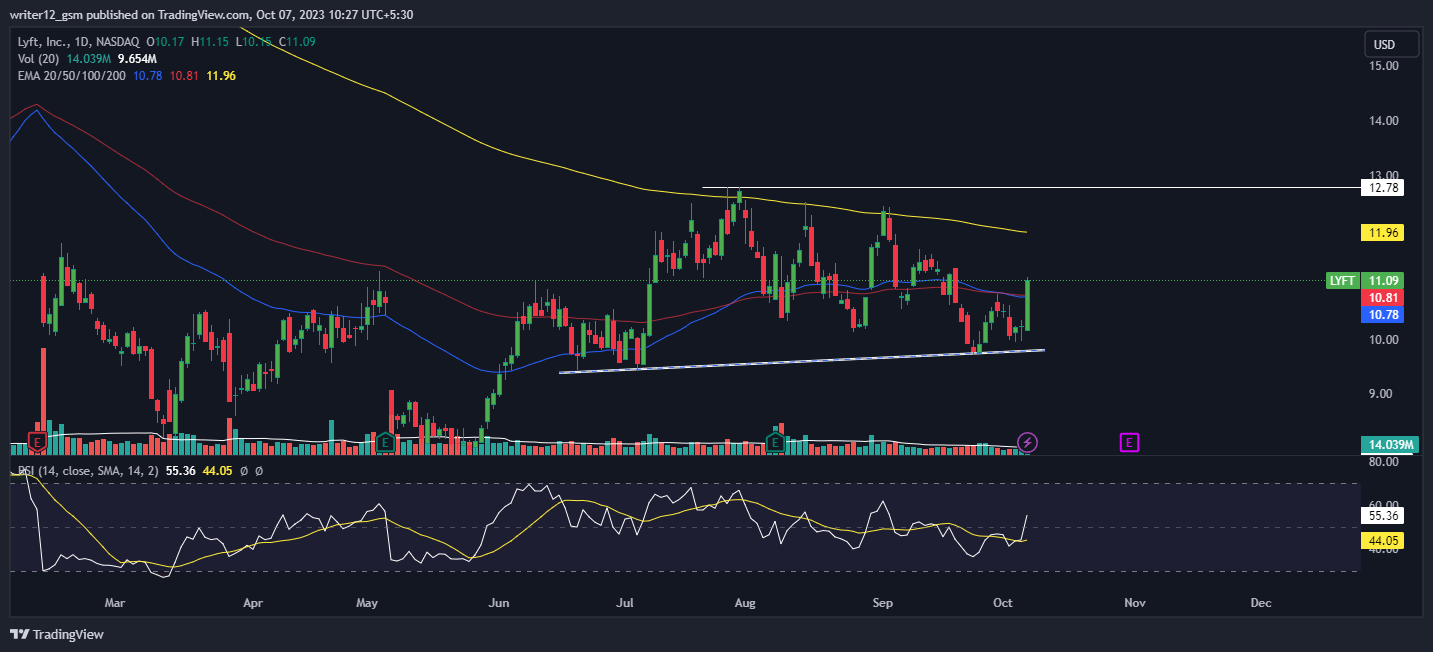
LYFT stock price is gaining momentum and broke above the 20, 50, and 100 EMAs, indicating bullishness in the previous trading sessions. The chart also shows a spike of 8.20% in the last trading session.
The stock has tested the demand zone near $10 multiple times, finding support and bouncing back with a powerful marubozu candle. Buyers have regained their strength and are aiming for the $12.78 level in the next sessions.

The chart structure shows a volatile movement in the previous months, with the stock facing multiple rejections from the 200 EMA acting as a supply zone. The lower levels near $10 acted as a support region, and the stock bounced from there, making the price trade in a narrow range.
Furthermore, the stock’s trajectory shows that beyond $12, the zone is bullish, and a rally could be seen. But, if further rejection takes place, then the stock will continue to trade in the congestion zone. Similarly, below $10, bearishness could be extended.
At press time, LYFT stock was trading at $11.09 with a remarkable intraday gain of 8.20%, breaking below the 100-day EMA, and showing bullishness on the charts. Moreover, the intraday trading volume is 14.039 Million, and the average 10-day volume of 10.002 Million. The market cap of LYFT shares is $4.283 Billion.
Technical Analysis: Will LYFT Stock Price Break the 200 EMA?
At the time of writing, LYFT stock (NASDAQ: LYFT) is trading above the 50 and 100-day SMAs (simple moving averages), which are supporting the price momentum.
However, if buying volume adds up, then the price might support bullish momentum by making higher highs and new highs. Therefore, the LYFT price is expected to move upwards giving bullish views over the daily time frame chart.
The current value of RSI is 55.36 points. The 14 SMA is below the median line at 44.05 points which indicates that the stock price is bullish.
The MACD line at -0.1683 and the signal line at -0.2129 are below the zero line. A bullish crossover is observed in the MACD indicator which signals strength in the momentum of the LYFT share price.
Short-Time Horizon Analysis
LYFT stock has shown buyers’ strength, and a spike in the stock price and volume was noted on the short-term charts. Moreover, the price was above the key EMAs, which shows further strength in the stock. The RSI curve is near the overbought region at 68, and a positive outlook was noted, indicating bullishness in the stock. The MACD indicator persisted to form green bars, and a bullish crossover was noted, which signals bullish moves in upcoming sessions.
Summary
LYFT stock (NASDAQ: LYFT) shows bullishness on the daily charts breaking above the 50 and 100-day moving averages. The MACD, RSI, and EMAs are showing bullish signs on the daily time frame. However, the real trend will be known when the price crosses the 200-EMA and sustains above it.
Technical Levels
Support Levels: $10.30 and $9.30.
Resistance Levels: $11.96 and $12.50.
Disclaimer
This article is for informational purposes only and does not provide any financial, investment, or other advice. The author or any people mentioned in this article are not responsible for any financial loss that may occur from investing in or trading. Please do your own research before making any financial decisions

Adarsh Singh is a true connoisseur of Defi and Blockchain technologies, who left his job at a “Big 4” multinational finance firm to pursue crypto and NFT trading full-time. He has a strong background in finance, with MBA from a prestigious B-school. He delves deep into these innovative fields, unraveling their intricacies. Uncovering hidden gems, be it coins, tokens or NFTs, is his expertise. NFTs drive deep interest for him, and his creative analysis of NFTs opens up engaging narratives. He strives to bring decentralized digital assets accessible to the masses.


