
 Home
Home News
News
- 1 Render price (RNDR) gained 6.85% in the past 24 hours and is currently trading at $1.87.
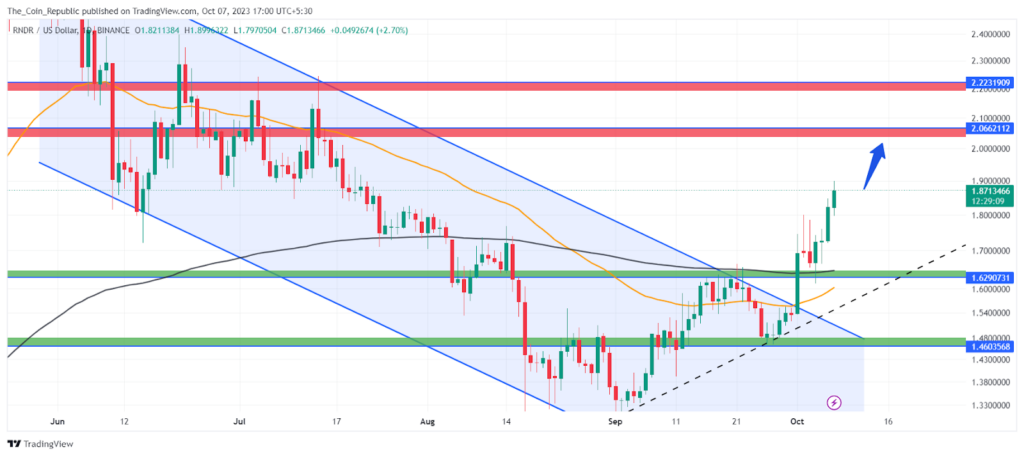
- 2 The daily chart shows that Render price experienced a breakout from a bullish flag pattern.
- 3 Render crypto price took support from the 200-day EMA and surged higher indicating strength.
Render crypto price surged 6.85% intraday to become the top gainer among the top 100 cryptos according to market cap. The daily chart illustrates a breakout of a bullish flag pattern. The breakout of this has hiked the price by over 20% in the last 1 week.
The price trend analysis states that the crypto entered a short-term correction phase after experiencing a selloff from a round level of $3 in the last week of May. Since then, the RNDR price struggled but kept declining in the channel and reached a low of $1.2 by the end of August.

Moreover, the bulls started accumulating from the very start of September and defended the lows which resulted in a breakout of the channel with rising volume and the price surged higher. The breakout of the bullish flag has shifted the short-term trend in favor of buyers.
The volume analysis shows that the RNDR crypto has received $47.04 Million in volume in the past 24 hours which is almost 67.19% more than the last day’s volume. The crypto holds a market cap of $692.8 Million and ranks 48th in the overall crypto market. The volume-to-market cap ratio is 4.73% indicating a mild volatility in the crypto.
Render Crypto Price Bounced Back From 200-day EMA
The Render price currently trades at $1.85 with an intraday gain of 6.85%. The breakout of the bullish flag pattern over the daily chart has shifted the short-term price in favor of buyers. The long-term trend is already bullish indicating the price might remain in the top gainers and surge to the higher levels.
Technical Indicators Show Optimistic Signals for RNDR
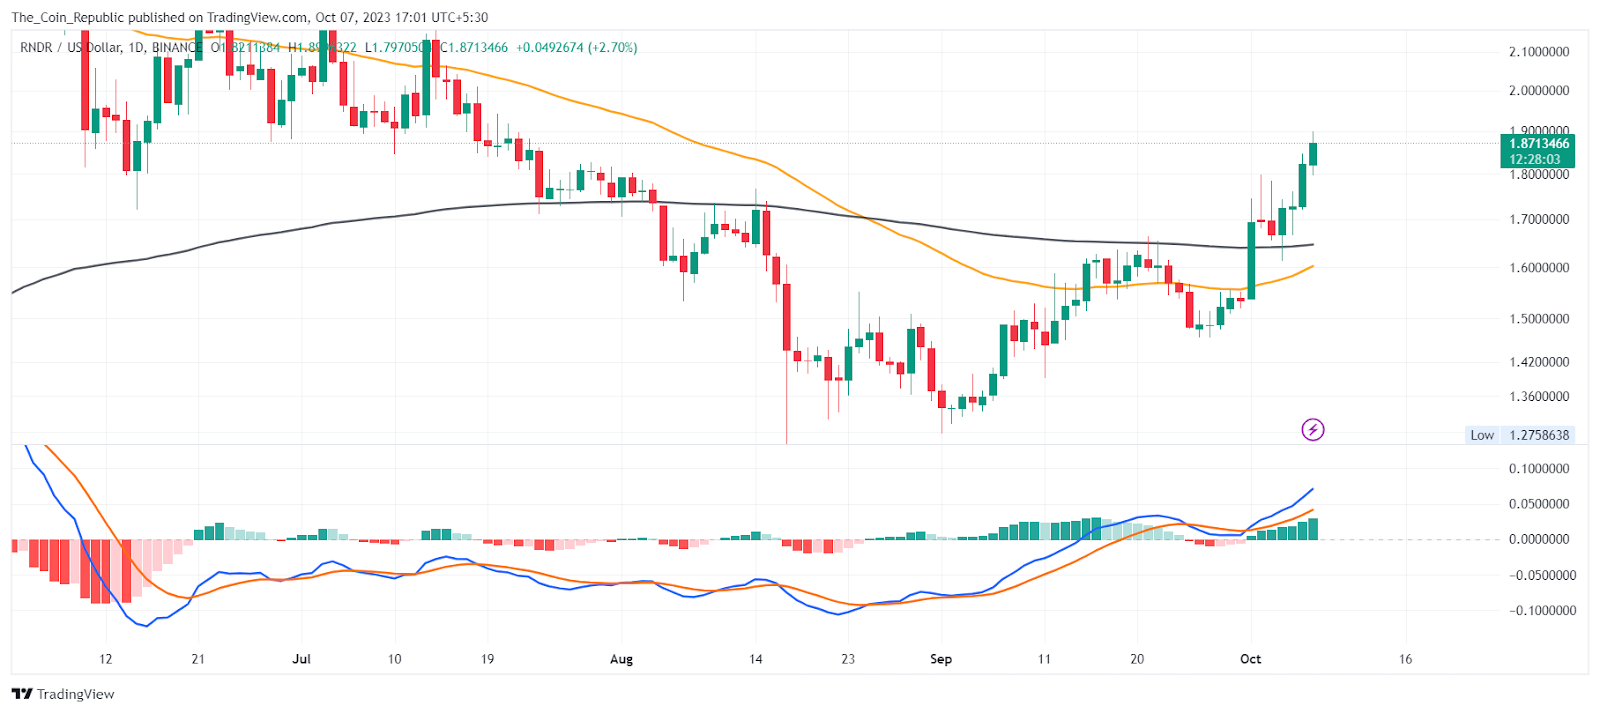
MACD lines are showing an optimistic crossover. The histogram bars are also being formed above the mean line of increasing height, indicating that the bulls have regained momentum.
The EMA analysis shows that the RNDR price trades above the 50-day and 200-day EMA indicating a bullish trend. Recently, the price bounced back from the 200-day EMA indicating the EMAs are acting as a dynamic support for the price.
Conclusion
Render crypto price rose 6.85% and became the top gainer among the top 100 cryptos. The price broke out of a bullish flag pattern and surged 20% in a week. The price was in a correction phase since May and reached a low of $1.2 in August. The price is now bullish in both short and long term. The volume is high and the market cap is $692.8 Million. The crypto ranks 48th in the market and has mild volatility. The price may reach higher levels soon.
Technical Levels
- Support Levels: $1.62 and $1.46
- Resistance Levels: $2.06 and $2.22
Disclaimer
The views and opinions stated by the author, or any people named in this article, are for informational purposes only and do not establish financial, investment, or other advice. Investing in or trading crypto or stock comes with a risk of financial loss.

With a background in journalism, Ritika Sharma has worked with many reputed media firms focusing on general news such as politics and crime. She joined The Coin Republic as a reporter for crypto, and found a great passion for cryptocurrency, Web3, NFTs and other digital assets. She spends a lot of time researching and delving deeper into these concepts around the clock, and is a strong advocate for women in STEM.


