
 Home
Home News
News

- 1 BCH price shows a rising parallel channel and tries to extend the gains.
- 2 Buyers need to gain momentum while sellers are engaged in profit booking.
Bitcoin Cash (BCH) price showed a panic selloff in yesterday’s session and has faded the initial momentum by losing more than 5%, indicating that a major block of sellers are aggressively making short positions and are looking to trap the bulls. Moreover, the chart shows a bearish engulfing candlestick heading to the lower trendline of $210 which is the immediate support zone where the 100-day EMA exists.

Furthermore, the bulls must sustain the gains near $210 and try to absorb the selling pressure for a healthy comeback amid the positive market sentiments. However, the BCH price did not surpass the primary hurdle of $230, faced strong rejection, and has retraced to the origin. Amid the bulls’ strong momentum, sellers quickly spoiled investors’ dreams and trapped the bulls, and a sharp sell-off was witnessed on the charts.

BCH price is trading inside the rising channel and trying to resume the ongoing bullish moves. Still, bears are trying their best to break the momentum and register aggressive selling in the last trading sessions.
At the press time, BCH’s price was trading at $216.30 with an intraday drop of 5%, showing bearish sentiment in yesterday’s market session. Moreover, the trading volume increased by 2.78% to $140.53 Million, and the pair of BCH/BTC is at 0.00787 BTC. However, the market cap of BCH is $4.15 Billion. Moreover, Analysts have maintained a neutral outlook and suggest that BCH will outperform in the sessions to follow.
Will BCH Continue To OutPerform Or Fizzle Out The Gains?
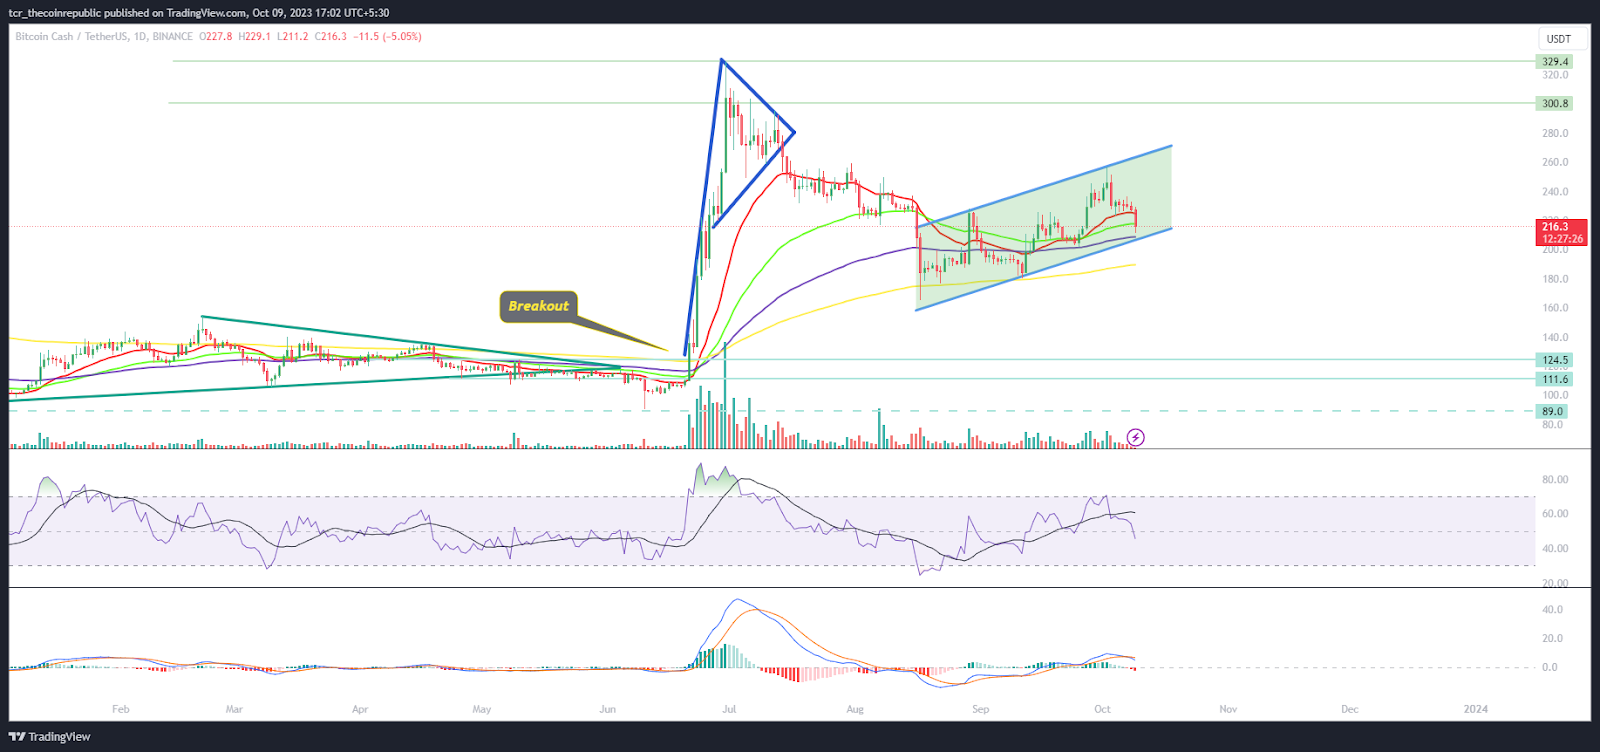
BCH forms a rising parallel channel on the daily charts and extends the gains, forming higher highs in the past sessions. However, sellers tried to trap the bulls and execute a sell-off in the last session, resulting in a fall of 5%. Moreover, the BCH price is trading close to the 100-day EMA, the immediate support zone for the bulls.
The RSI curve shows a fall below neutrality, and heading toward the oversold region indicates the selling pressure in yesterday’s trading session.
The MACD indicator showed a bearish crossover and formed red bars on the histogram, suggesting that follow-on selling may continue if it fails to hold a 100-day EMA.
Summary
BCH price is trading close to the 100-day EMA, and bulls are in trouble due to the panic selling pressure witnessed in the last trading session. Moreover, the price has dragged toward the channel lower trendline. The bulls are trying to recover the gains and are attempting a pullback. However, the sellers did not let back and showed their giant muscles and executed the sell-off.
Technical Levels
Support Levels: $210 and $200
Resistance Levels: $220 and $230
Disclaimer
The views and opinions stated by the author or any other person named in this article are for informational purposes only and do not constitute financial, investment, or other advice. Investing in or trading crypto or stocks comes with a risk of financial loss.

Adarsh Singh is a true connoisseur of Defi and Blockchain technologies, who left his job at a “Big 4” multinational finance firm to pursue crypto and NFT trading full-time. He has a strong background in finance, with MBA from a prestigious B-school. He delves deep into these innovative fields, unraveling their intricacies. Uncovering hidden gems, be it coins, tokens or NFTs, is his expertise. NFTs drive deep interest for him, and his creative analysis of NFTs opens up engaging narratives. He strives to bring decentralized digital assets accessible to the masses.


