
 Home
Home News
News
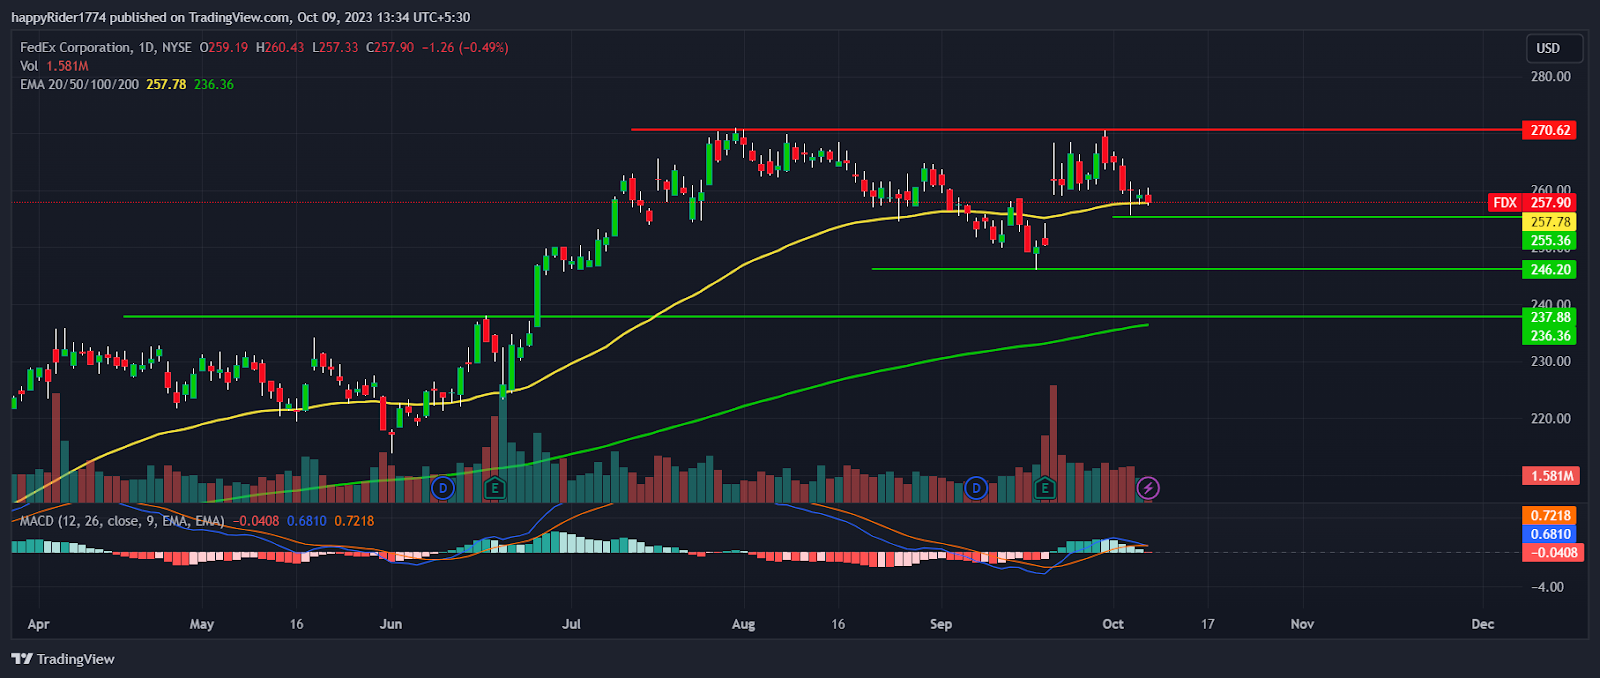
- 1 FedEx stock price (NYSE: FDX) corrected 5% after hitting the 52-week high.
- 2 FDX stock price retraced down to the 50-day EMA.
- 3 The bullish momentum in FedEx Corp. stock has halted.
FedEx stock price (NYSE: FDX) corrected 5% from the recent swing high. It declined by forming lower-low candles and retraced down to the 50-day EMA. FDX stock price is reversing down and it is showing initial signs of bearish trend reversal. However, the confirmation will come when the price drops below $246.00 support.
FedEx Corp. stock price performed well in 2023 and was up by 45.48% on a YTD basis. In June 2023, FDX stock price broke out of a $246.00 hurdle with high volume.
The breakout looks reliable and seems that some genuine investors have injected the money. So, if the price declined further and came near the support, then the probability of a bounce back is high.
FedEx stock price dropped below its consolidation so it is likely to trade with a mild bearish bias. At present, $255.36 will be acting as immediate support for the bulls. If sellers took over the control and dragged the price below $255.36, then 3% to 5% more downside will open. FedEx stock price closed the previous session at $257.90 with an intraday decline of -0.49%. The market capitalization stands at $64.84 Billion.
Is FedEx Stock Price Entering a Correction Phase?
FedEx stock price is in a short-term correction phase and sellers seem to be more active as compared to buyers. Therefore, more downside is possible by month end.
However, till the FDX price sustains above $246.00, the positional trend is expected to remain in a bullish grip. It will be interesting to see how the price reacts near the support which will decide whether FDX stock will test the previous high by December end or not.
The technical analysis suggests FedEx shares may fall more in October but sellers must be cautious near the $246 level.
FDX Stock Price: Is Bullish Momentum Halted?
The bullish momentum in FDX stock price has halted and the price reverted down. It seems that short-term bullish traders are booking profit from higher levels.
Meanwhile, the broader market indices like the S&P 500 and Dow Jones are mildly bearish. So, it may also indirectly affect the FedEx stock for a short period of time. The MACD curve slopes sideways and may generate a negative crossover. It indicates that the price may trade bearish bias for a few weeks.
Conclusion
FedEx stock price (NYSE: FDX) reversed and corrected approximately 5% after hitting the 52-week high. The analysis suggests that FDX stock is in a short-term correction phase and more downside may come. However, short sellers must be careful near $246.00 support.
Technical Levels
- Resistance Levels: $265.00 and $270.62
- Support Levels: $246.20 and $237.88
Disclaimer
The views and opinions stated by the author, or any people named in this article, are for informational purposes only. They do not establish financial, investment, or other advice. Investing in or trading crypto assets comes with a risk of financial loss.

Andrew is a blockchain developer who developed his interest in cryptocurrencies while pursuing his post-graduation major in blockchain development. He is a keen observer of details and shares his passion for writing, along with coding. His backend knowledge about blockchain helps him give a unique perspective to his writing skills, and a reliable craft at explaining the concepts such as blockchain programming, languages and token minting. He also frequently shares technical details and performance indicators of ICOs and IDOs.


