
 Home
Home News
News
- 1 Ocean protocol price (OCEAN) slid 4.86 % in the past 24 hours and is currently trading at $0.285.
- 2 The daily chart shows that Ocean protocol price experienced a breakdown of an ascending triangle pattern.
- 3 Ocean protocol crypto price suffered rejection from the 200-day EMA and made a breakdown below the $0.3 level.
Ocean protocol crypto price analysis demonstrates a bearish dominance in the short term as well as the long term. The Ocean crypto price is down 4.85% in Intraday and might show more decline by the end of the sessions. The price is currently nearing the support of $0.27 which might try to halt the declining momentum.
The price trend illustrates that the crypto price has been in a long-term correction phase since the last week of February and elaborates on the formation of a declining channel pattern over the daily chart. The Ocean crypto price has been respecting the channel for the last seven months and has wiped out nearly 38% in the period.

The volume analysis shows that the OCEAN crypto has received $10.08 Million in volume in the past 24 hours which is almost 37.01% more than the last day’s volume. The crypto holds a market cap of $402.5 Million and ranks 75th in the overall crypto market. The volume-to-market cap ratio is 2.45% indicating low volatility in the crypto.
Ocean Protocol Price Suffered Rejection From 200-Day EMA
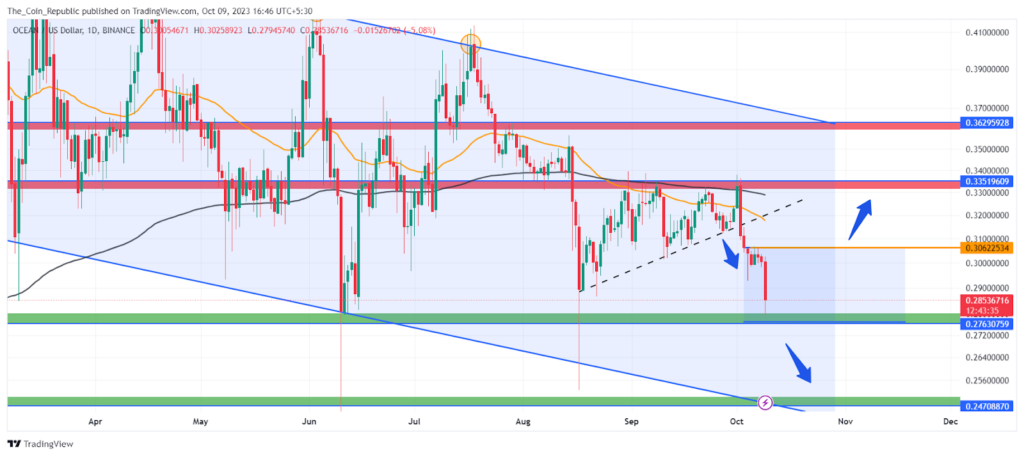
Currently, the price trades at $0.285 and has an immediate support of $0.276. However, the crypto price has made a breakdown after suffering rejection from the 200-day EMA with momentum indicating the sellers’ control over the trend. Hence, the price might show a breakdown if it continues with the same momentum to the downside. Also, the price has some more space on the downside till the lower boundary of the declining channel pattern and a major support of $0.25.
Technical Indicators Show Optimistic Signals for OCEAN
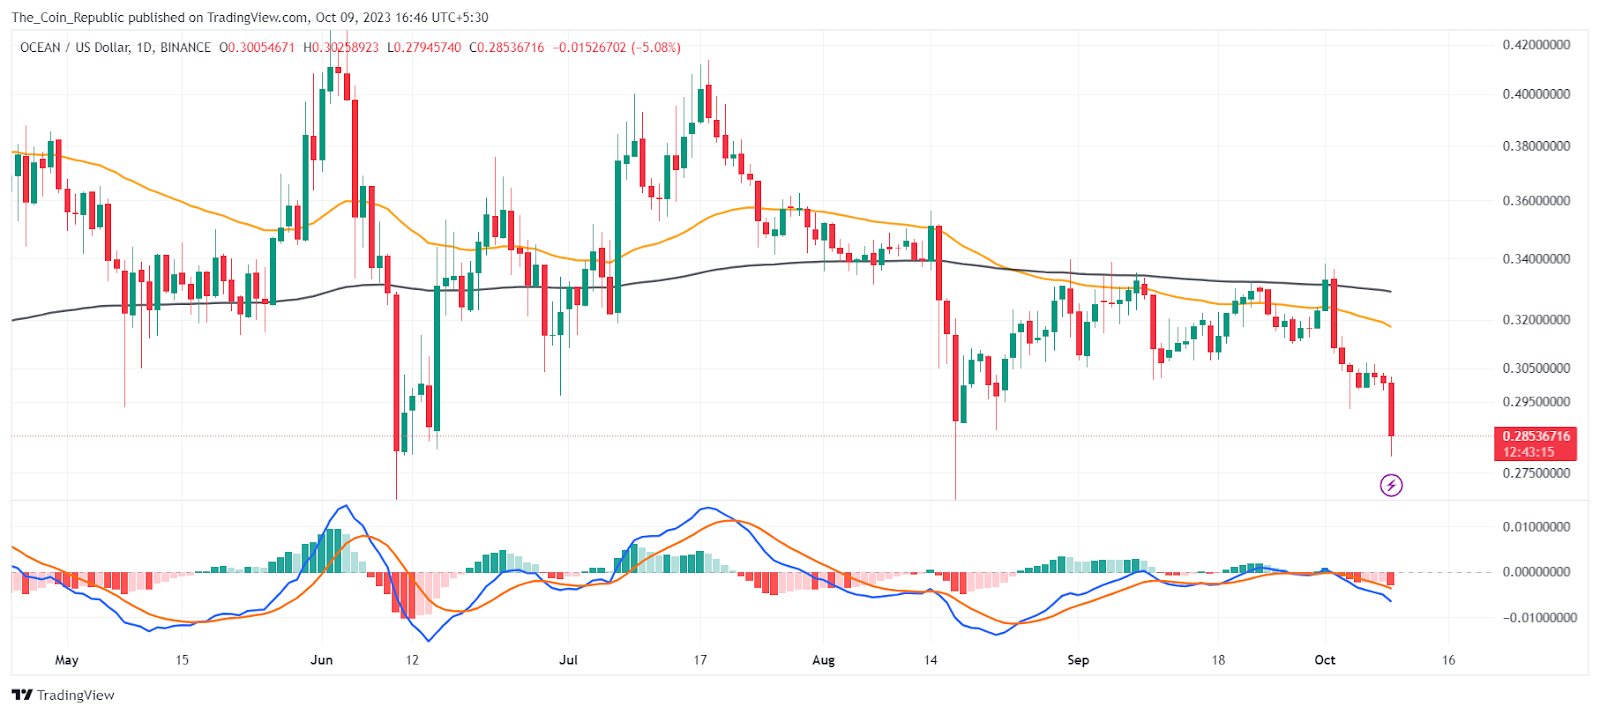
MACD lines are showing a pessimistic crossover. The histogram bars are also being formed above the mean line of increasing height, indicating that the bears have gained momentum and the price might test lower levels.
The EMA analysis shows that the OCEAN price trades below the 50-day EMA indicating the domination of bears in the short term. Moreover, the price suffered rejection from the 200-day EMA and showed a breakdown of an ascending triangle pattern indicating the dominance of bears at the upper levels.
Conclusion
Ocean protocol crypto price persists in a bearish trend in the short term as well as the long term. The price trend analysis shows that the Ocean price is in a long-term correction phase and forms a declining parallel channel pattern over the daily chart. The volume analysis shows that the breakdown is supported by a rise in volume indicating the dominance of sellers’ commitment to drag the price to the lower levels. The technical indicators also signal the continuation of the ongoing trend.
Technical Levels
- Support Levels: $0.276 and $0.247.
- Resistance Levels: $0.306 and $0.335.
Disclaimer
The views and opinions stated by the author, or any people named in this article, are for informational purposes only and do not establish financial, investment, or other advice. Investing in or trading crypto or stock comes with a risk of financial loss.
Steve Anderson is an Australian crypto enthusiast. He is a specialist in management and trading for over 5 years. Steve has worked as a crypto trader, he loves learning about decentralisation, understanding the true potential of the blockchain.


