
 Home
Home News
News
- 1 Qcom stock has been falling through an interesting declining pattern over the daily time frame chart.
- 2 QCOM shares are trading at 20-EMA to surge above 50, 100 and 200-days daily moving averages.
- 3 Qualcomm Inc (NASDAQ: QCOM) stock declined slightly around 0.22% year to date.
Qualcomm Inc, QCOM stock price has been following a notable downward trend on the daily chart. This declining pattern, which started in August 2023, suggests that buyers need to step in to support QCOM shares. At the moment, the 50-day exponential moving average (EMA) is acting as a significant resistance level for QCOM’s stock price. QCOM is also facing challenges in reaching the 200-day daily moving average, which is crucial for signaling a potential recovery phase.
Furthermore, Qualcomm stock is currently making efforts to stay above the 20-day exponential moving average (EMA) as it aims to sustain its recovery in Tuesday’s trading session. However, in order to continue its upward momentum and move closer to the upper trendline, QCOM’s share price must attract more buyers and surpass the 50-day EMA. It’s worth noting that QCOM’s stock price has been following a distinctive downward channel since August 2023 on the daily time frame chart.

Qualcomm stock price was at $111.10, and it experienced a slight gain of approximately 0.04% in its market capitalization during Monday’s trading session. However, the trading volume was lower than usual, and there is a need for it to increase in Tuesday’s trading session. This suggests that there is an instruction for buyers in QCOM to accumulate shares at a higher rate during Tuesday’s trading session.
Will QCOM Stock Register its Breakout?
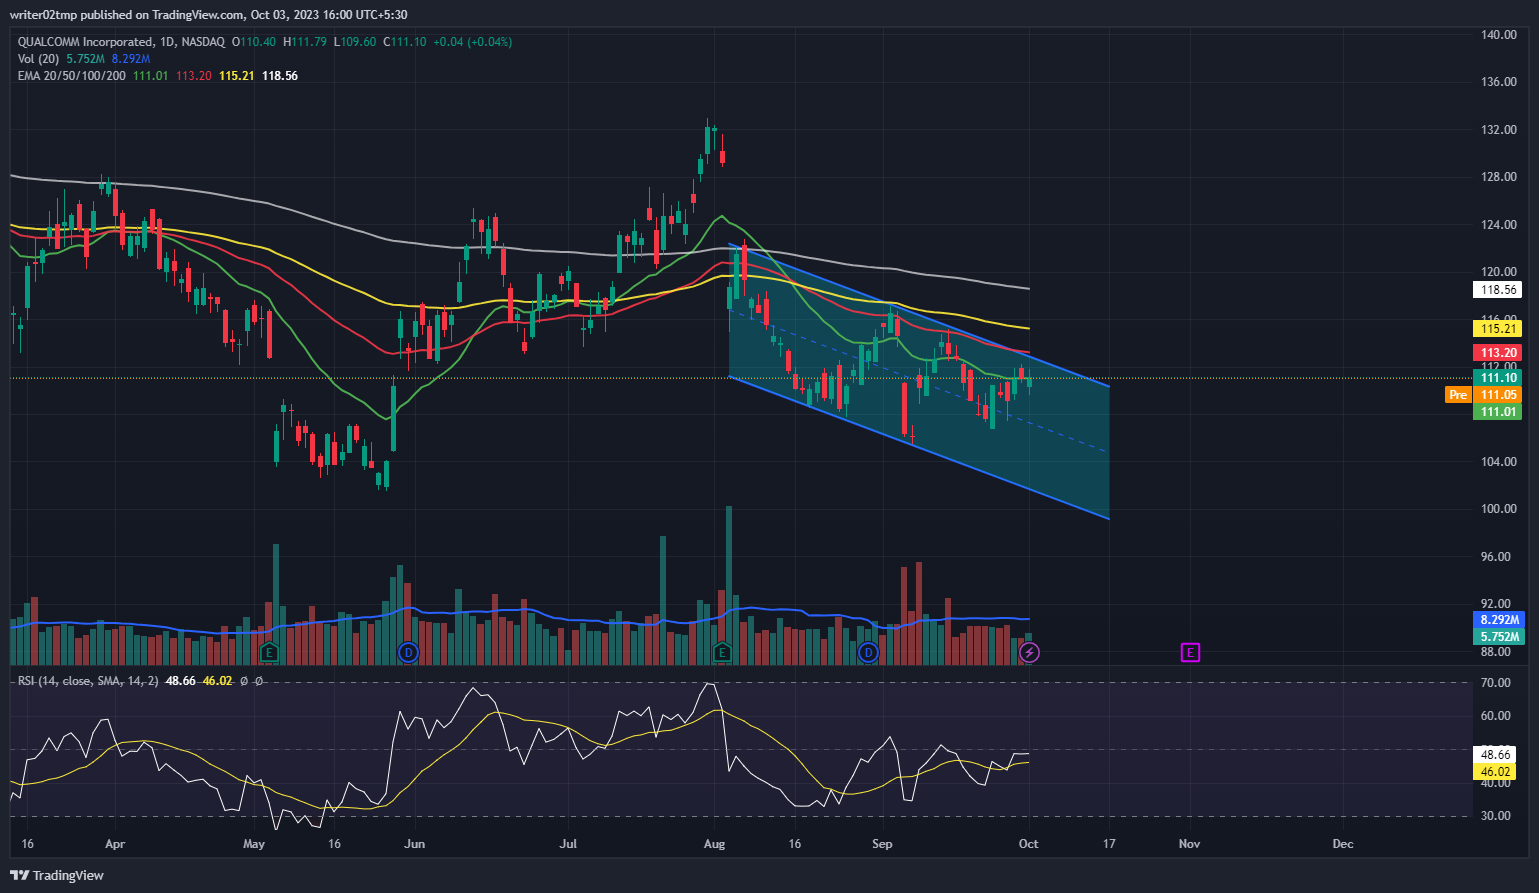
QCOM stock price has been declining through an interesting descending parallel channel over the daily time frame chart. However, buyers need to accumulate at a higher rate in order to push QCOM share price upwards. Volume change is below average and needs to grow during Tuesday’s trading session. Meanwhile, Qualcomm stock is trading at 20-EMA to surge above 50, 100 and 200-days daily moving averages.
Over the past week, Qualcomm stock saw an increase of approximately 3.99%. However, in the span of a month, it experienced a decline of 3.98%. Looking at a broader timeframe, QCOM has declined by 6.85% over the last three months and 8.50% over the last six months. Furthermore, on a year-to-date basis, QCOM stock has decreased by approximately 0.22%.
Technical indicators suggest the struggle of QCOM stock inside the declining parallel channel pattern. Relative strength index (RSI) shows the wait of QCOM for any directional change. RSI was at 48 and is flat below neutrality. Investors in Qualcomm Inc (NASDAQ: QCOM) need to wait until QCOM stock reaches the upper threshold of the declining pattern.
Summary
Qualcomm Inc, QCOM stock price has been following a notable downward trend on the daily chart. Furthermore, Qualcomm stock is currently making efforts to stay above the 20-day Exponential Moving Average (EMA) as it aims to sustain its recovery in Tuesday’s trading session. Technical indicators suggest the struggle of QCOM stock inside the declining parallel channel pattern.
Technical Levels
Support Levels: $109.15 and $107.65
Resistance Levels: $112.35 and $113.85
Disclaimer
The views and opinions stated by the author, or any people named in this article, are for informational purposes only, and they do not establish financial, investment, or other advice. Investing in or trading crypto or stock comes with a risk of financial loss.

Adarsh Singh is a true connoisseur of Defi and Blockchain technologies, who left his job at a “Big 4” multinational finance firm to pursue crypto and NFT trading full-time. He has a strong background in finance, with MBA from a prestigious B-school. He delves deep into these innovative fields, unraveling their intricacies. Uncovering hidden gems, be it coins, tokens or NFTs, is his expertise. NFTs drive deep interest for him, and his creative analysis of NFTs opens up engaging narratives. He strives to bring decentralized digital assets accessible to the masses.


