
 Home
Home News
News
- 1 Quant price prediction indicates the fall of QNT crypto inside an interesting pattern over the daily time frame chart.
- 2 QNT crypto slipped below 20, 50, 100 and 200-days daily moving averages.
- 3 Quant cryptocurrency has slumped around 18.65% year to date.
Quant price prediction shows a decline within a notable pattern on the daily chart. Sellers are actively pushing QNT towards the lower trendline. QNT has been in a descending parallel channel since April 2023, and for a potential breakout, buyers must increase their accumulation, despite lower-than-average trading volume.
At the time of writing, the Quant price was $85.58, reflecting a 2.61% decrease in its market capitalization intraday. Interestingly, trading volume surged by 43.76% intraday, indicating active buyer participation, potentially pushing QNT upward. The volume-to-market-cap ratio stood at 1.43%.
Will Quant Price Leave the Declining Pattern?
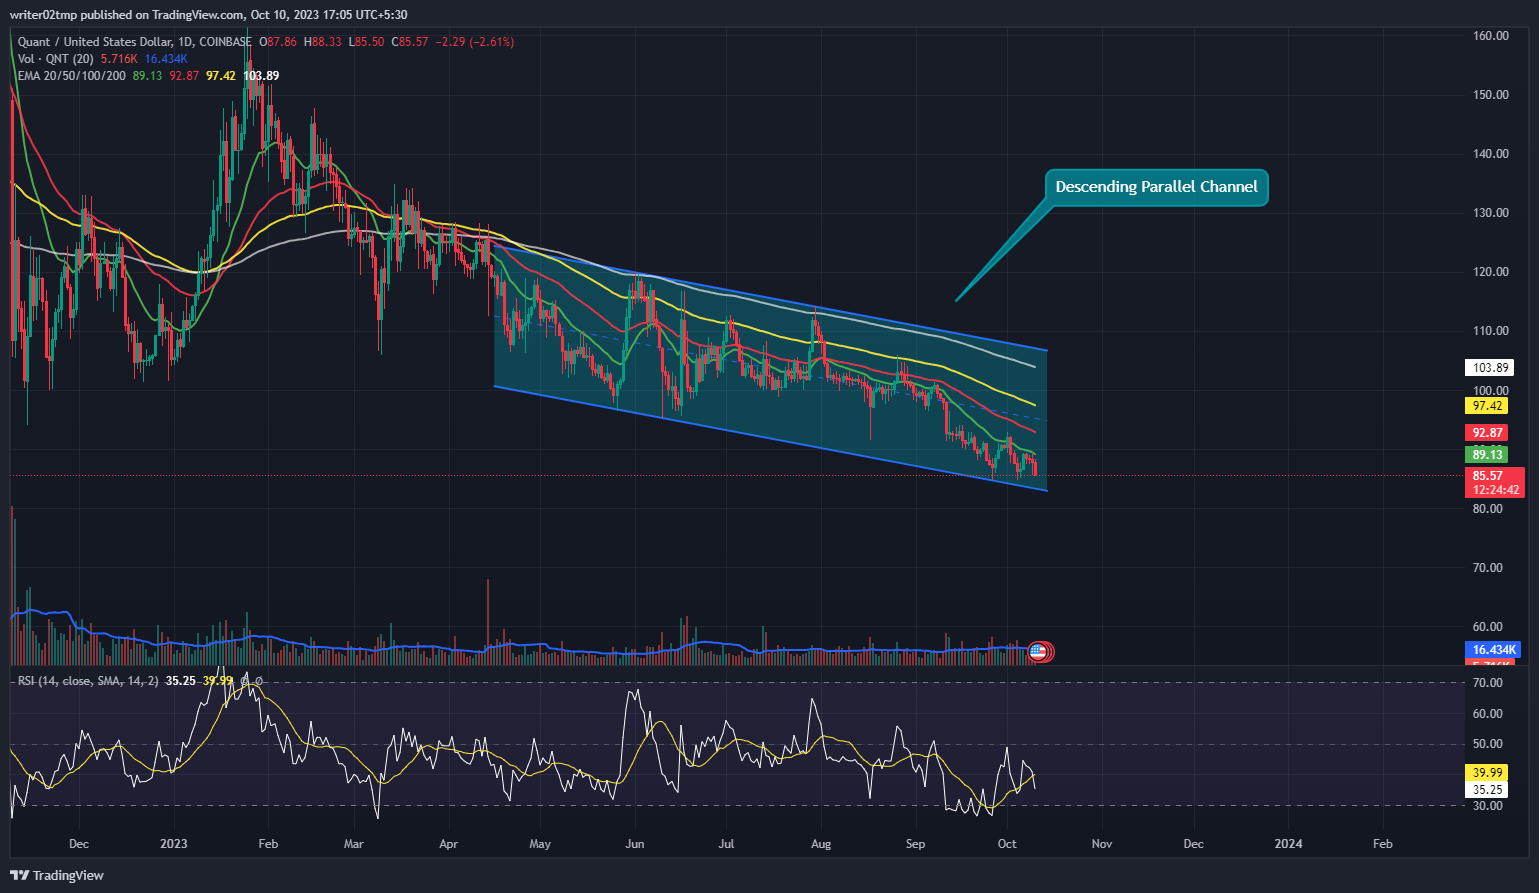
Quant price prediction highlights the fall of QNT crypto through a descending parallel channel over the daily time frame chart. QNT has been falling since April 2023 and has been looking for a desirable support to recover from the declining pattern. Buyers need to accumulate at a higher rate in order to push QNT upwards to register its breakout. However, volume change was below average and needs to grow intraday.
Examining market sentiment regarding Quant cryptocurrency, it’s evident that the community of investors and traders is closely observing the price action. The prevailing sentiment seems to be one of prudence, given QNT’s extended descent within a clearly delineated pattern on the daily chart.
This cautious perspective likely stems from the protracted duration of the decline, which has persisted since April 2023. Market participants are eagerly anticipating indicators of a turnaround or resurgence in the QNT market, as suggested by technical measures and fluctuations in trading volume.
Quant price declined 4.08% last week and by 13.18% drop last month. On the longer time frame, QNT has experienced a 16.53% decrease over the past three months and a substantial 29.71% drop over the past six months. Additionally, in terms of year-to-date performance, Quant has lost 18.65% of its value.
Technical indicators indicate a potential decline for Quant cryptocurrency, nearing the lower trendline of the descending channel pattern. The relative strength index (RSI) validates this downtrend, with RSI at 35 and approaching oversold levels. Investors in Quant should monitor for any shifts in direction on the daily chart.
Summary
Quant price prediction points towards a decline within a significant pattern on the daily chart. Sellers are actively driving QNT towards the lower trendline. Since April 2023, QNT has been on a downward trajectory, searching for a suitable support level to initiate a recovery from this declining pattern. In addition, Quant has lost 18.65% of its value year-to-date. Technical indicators suggest a potential further decline for Quant cryptocurrency, approaching the lower trendline of the descending channel pattern. Investors should remain vigilant for any potential changes in direction on the daily chart.
Technical Levels
Support Levels: $85.20 and $84.50
Resistance Levels: $89.50 and $92.55
Disclaimer
The views and opinions stated by the author, or any people named in this article, are for informational purposes only, and they do not establish financial, investment, or other advice. Investing in or trading crypto or stock comes with a risk of financial loss.

With a background in journalism, Ritika Sharma has worked with many reputed media firms focusing on general news such as politics and crime. She joined The Coin Republic as a reporter for crypto, and found a great passion for cryptocurrency, Web3, NFTs and other digital assets. She spends a lot of time researching and delving deeper into these concepts around the clock, and is a strong advocate for women in STEM.


