
 Home
Home News
News
- 1 AI stock currently is below the key moving averages.
- 2 C3.ai stock price shows a reversal from the threshold of $23.50.
AI stock price surged 8.13% in the last trading session, bouncing back from the threshold of $23.49 and is heading towards the 200 EMA level which is acting as a resistance.
AI stock price is gaining momentum indicating bullishness in the past trading sessions.

The stock tested the demand zone near $23.50 multiple times, finding support and bouncing back. Buyers have regained their strength and are aiming for the $28.00 level in the following coming sessions.
The chart structure shows volatility in the past months. However, the lower levels near $23 acted as a support region, and the stock bounced from there.
Furthermore, the stock’s trajectory shows that beyond $30, the zone is bullish, and that a rally is expected. But, if further rejection takes place, the stock will stay in the congestion zone. Similarly, below $23.50, bearishness could be extended.
At press time, AI stock was trading at $26.72 with an intraday gain of 8.13% showing bullishness on the charts. Moreover, the intraday trading volume also showed an incline of 11.077 Million more than the average 10-day volume of 6.089 Million. The market cap of AI stock is 3.065 Billion.
Will AI Stock Price Reach $30?
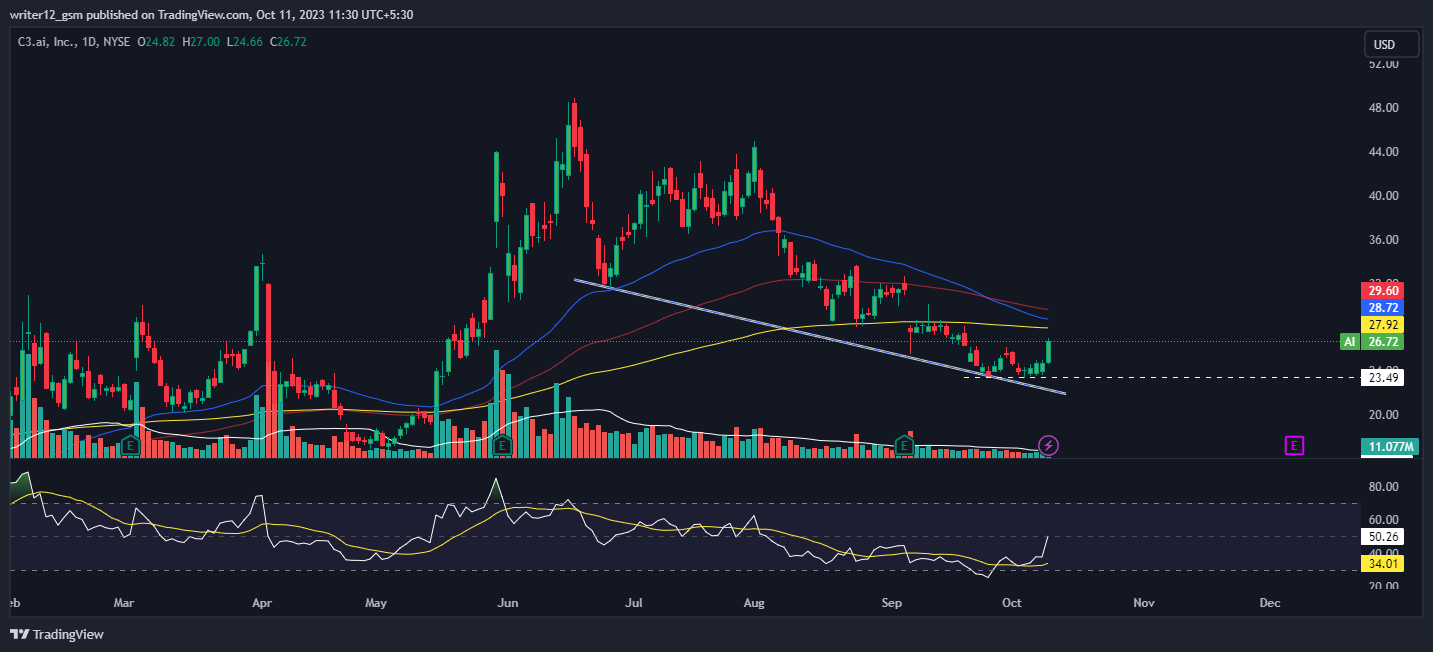
Currently, AI stock (NYSE: C3.ai) is trading below the 50 and 200-day exponential moving averages (EMAs), which are not supporting the price momentum.
However, if buying volume adds up, then the price might support bullish momentum by making higher highs and new highs. Hence, the AI price is expected to move upwards giving bullish views over the daily time frame chart.
The current value of RSI is 50.26 points. The 14 SMA is above the median line at 34.01 points which indicates that the AI stock is bullish.
The MACD line at -1.33 and the signal line at -1.72 are below the zero line. A bullish crossover is observed in the MACD which signals strength in the momentum of the C3.ai stock price.
Conclusion
AI stock price halted near the value of $48.94 and the seller kept pushing the price down. However, the stock price took support at $23.50 and tried to bounce back from there, showing bullishness on the daily time frame. The MACD and RSI are supporting the stock price indicating bullishness in the upcoming sessions.
Technical Levels
Support Levels: $23.49 and $20.00
Resistance Levels: $27.92 and $28.72
Disclaimer
This article is for informational purposes only and does not provide any financial, investment, or other advice. The author or any people mentioned in this article are not responsible for any financial loss that may occur from investing in or trading. Please do your own research before making any financial decisions.

Adarsh Singh is a true connoisseur of Defi and Blockchain technologies, who left his job at a “Big 4” multinational finance firm to pursue crypto and NFT trading full-time. He has a strong background in finance, with MBA from a prestigious B-school. He delves deep into these innovative fields, unraveling their intricacies. Uncovering hidden gems, be it coins, tokens or NFTs, is his expertise. NFTs drive deep interest for him, and his creative analysis of NFTs opens up engaging narratives. He strives to bring decentralized digital assets accessible to the masses.


