
 Home
Home News
News
- 1 KAVA crypto is trading below key moving averages.
- 2 KAVA crypto is exhibiting bearish pressure at the higher levels.
At present, the bears are in charge of the trend, maintaining firm command over the price action. Although the bulls attempted to take control, the buyers were unable to break above 200 EMA, and bears regained supremacy over the price action on the 1-day chart.
KAVA crypto is trading under the key exponential moving averages within the bears’ grasp. The price is facing resistance from the 50 EMA at present on the daily time frame. The price is facing substantial selling pressure in the supply zone which indicates that bears may push its value down further in the near future.

Technical indicators suggest that bears are in control. The price pattern, oscillators, EMAs, and volume are moving in tandem, giving similar signals.
KAVA price prediction indicates that the KAVA crypto may see further depreciation in its value within the next few months. Presently, the KAVA price has been down by 5.47% over the past 7 days and according to the price action, it is facing bearish pressure.
At the time of writing, KAVAUSD price was $0.5817 with an intraday drop of 2.60%, signaling bearishness. Moreover, the trading 24-hour volume is 8.853 Million with the FD Market cap of $486.214 Million.
Technical Analysis of KAVA Crypto Price in 1-D Time Frame
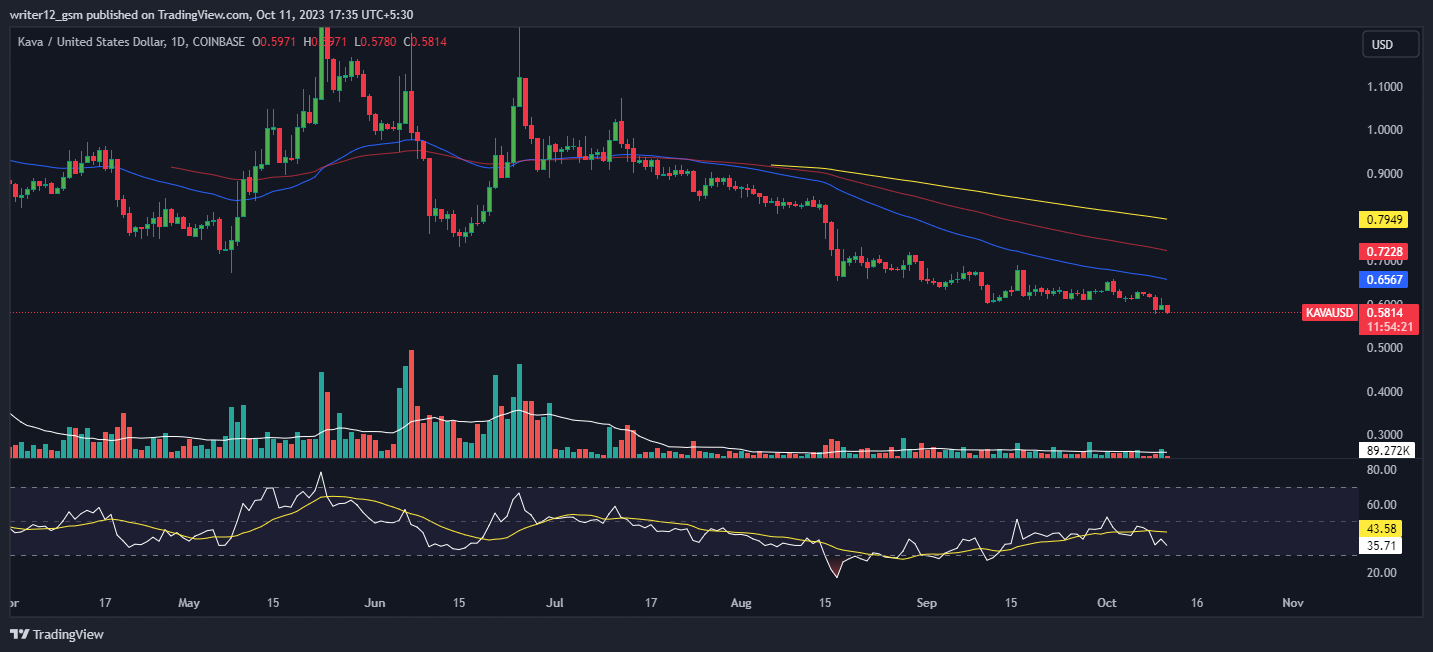
At the time of publishing, KAVA crypto (KAVAUSD) is trading above the 50 and 200-day simple moving averages (SMAs), which are supporting the price trend.
However, if selling volume adds up then the price might conquer supporting SMAs by making lower highs and lows. Hence, the KAVAUSD price is expected to move downwards giving bearish views over the daily time frame chart.
The current value of RSI is 35.71 points. The 14 SMA is above the median line at 43.58 points which indicates that the KAVA crypto is bearish.
The MACD line at -0.0140 and the signal line at -0.0119 are below the zero line. A bearish crossover is observed in the MACD indicator which signals more bearishness for the KAVAUSD crypto price.
Summary
KAVA crypto technical oscillators also support the bearish trend. The MACD, RSI, and EMAs are emphasizing negative signs and imply that the downtrend may continue in the KAVAUSD crypto price. KAVA price action suggests that the investors and traders are bearish on the 1-day time frame. The price action reflects a bearish perspective at the moment.
Technical Levels
- Support Levels: $0.5000 and $0.4500.
- Resistance Levels: $0.6568 and $0.7229.
Disclaimer
This article is for informational purposes only and provides no financial, investment, or other advice. The author or any people mentioned in this article are not responsible for any financial loss that may occur from investing in or trading. Please do your own research before making any financial decisions

With a background in journalism, Ritika Sharma has worked with many reputed media firms focusing on general news such as politics and crime. She joined The Coin Republic as a reporter for crypto, and found a great passion for cryptocurrency, Web3, NFTs and other digital assets. She spends a lot of time researching and delving deeper into these concepts around the clock, and is a strong advocate for women in STEM.


