
 Home
Home News
News
- 1 SQ stock price is below the key moving averages.
- 2 Block stock price is showcasing a mild reversal sign on the daily time frame.
SQ stock price has been on a downtrend for the past three months, as it faced resistance from the higher levels and formed lower lows. This shows that the bears have been in control and the stock has lost momentum. The stock has also broken below the key moving averages, which indicates further weakness.
SQ stock price returned to its previous breakout level, which could act as support. Technical analysis suggests that the stock is oversold and could bounce back from the lower levels. However, the stock showed some signs of strength and reversal confirming a pullback rally.

SQ share price is in a correction phase but near the crucial support of $40.00. If formed, a bullish candle indicates buyers are active and will try their best to rebound. Block stock price closed the previous session at $46.00 with an intraday gain of 5.24%.
If buyers succeed in defending the current support then the possibility of a bounce back will increase. However, if the sell-off continues and SQ stock drops below lower levels more downfall is possible.
Buyers tried multiple times to break the higher range and expand upwards. However, due to the strong presence of sellers, prices faced rejection. It shows sellers are still active on higher levels.
Technical Analysis of SQStock Price in 1-D Time Frame
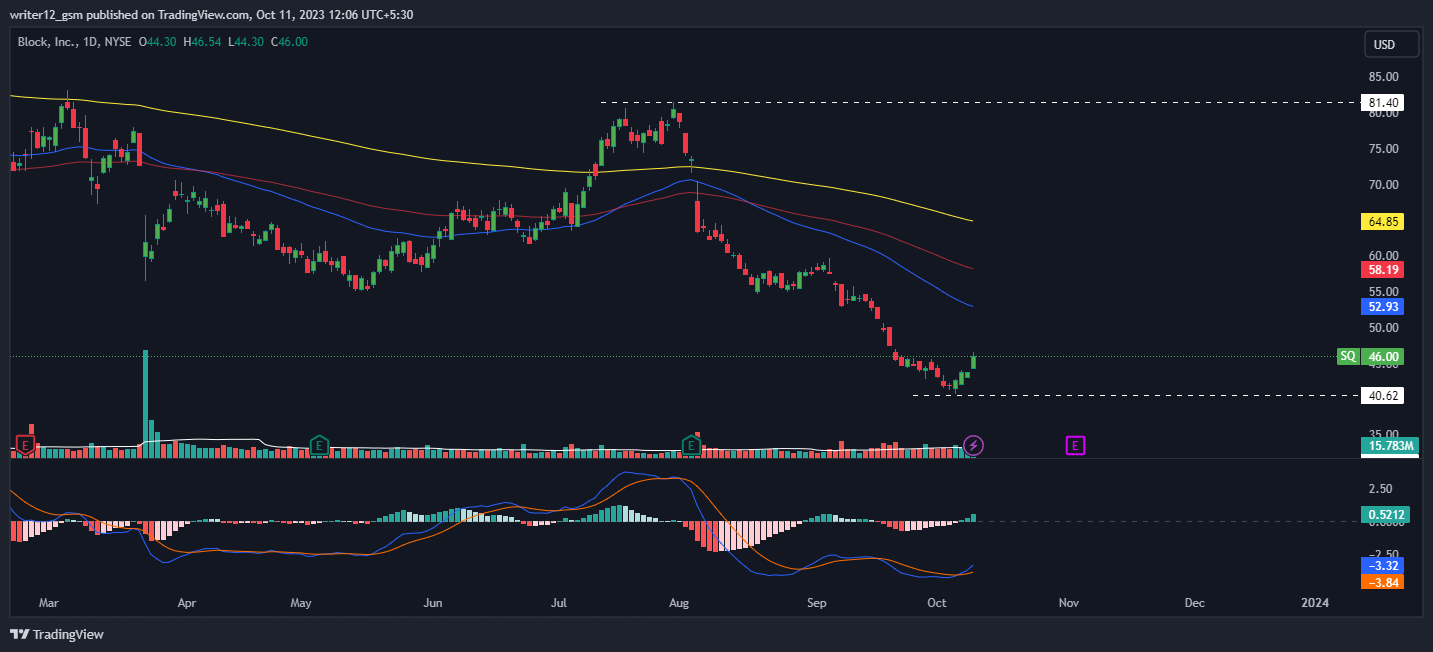
SQ price is trading below the downward-sloping 50-day and 200-day EMAs showcasing a downtrend. However, the SQ stock price has gone far away from the EMAs.
The MACD generated a positive crossover and the histogram is also green indicating bullishness. The current value of RSI is 40.98 points. The 14 SMA is above the median line at 23.12 points which indicates that the SQ stock is bullish.
Weekly-Time Horizon Analysis
SQ stock has shown sellers’ strength on the weekly charts. Moreover, the price is below the key EMAs, which shows further weakness in the stock. The RSI curve is near the oversold region at 35, and a negative outlook was noted, indicating bearishness in the stock. The MACD shows red bars, and a bearish crossover was noted, which signals corrective moves.
Summary
SQ stock price technical oscillators suggest a bearish trend. The MACD and RSI, are emphasizing positive signs and imply that a rally could be seen in the Block stock price. SQ stock price action suggests that the investors and traders are mildly bullish on the 1-day time frame. The price action reflects a bullish perspective at the moment.
Technical Levels
- Support Levels: $40.62 and $35.00
- Resistance Levels: $50.00 and $52.92
Disclaimer
This article is for informational purposes only and does not provide any financial, investment, or other advice. The author or any people mentioned in this article are not responsible for any financial loss that may occur from investing in or trading. Please do your own research before making any financial decisions.
Steve Anderson is an Australian crypto enthusiast. He is a specialist in management and trading for over 5 years. Steve has worked as a crypto trader, he loves learning about decentralisation, understanding the true potential of the blockchain.


