
 Home
Home News
News
- 1 Aave price prediction showcases the consolidation phase of AAVE after slipping from the recovering pattern.
- 2 AAVE crypto is trying to sustain at 50 and 100-days DMAs to recover towards 20 and 200-days daily moving averages.
- 3 Aave cryptocurrency gained around 22.95% year to date.
Aave price prediction indicates the sideways momentum of AAVE crypto below the rising pattern over the daily time frame chart. AAVE crypto has been recovering through an interesting rising parallel channel pattern from September 2023. However, on October 9th, AAVE crypto couldn’t sustain at the lower trendline of the rising parallel channel and fell from the channel to consolidate. Buyers need to accumulate at a high rate in order to push AAVE back inside the recovery pattern.
In addition to the recent consolidation, AAVE crypto is facing challenges due to a decline in trading volume. Lower trading volume suggests that market activity has decreased, indicating a potential lack of strong buying interest. A resurgence in trading activity, combined with strong buying support, could help AAVE regain its momentum and re-enter the ascending parallel channel for steady growth.

AAVE price was at $63.73 and gained slightly around 0.74% of its market capitalization intraday. However, trading volume has decreased by 9.75% during the intraday trading session. This demonstrates that sellers are still present in the trade to pull AAVE downwards. Volume to market cap ratio was at 3.67%.
Analyzing AAVE Price Technical Indications
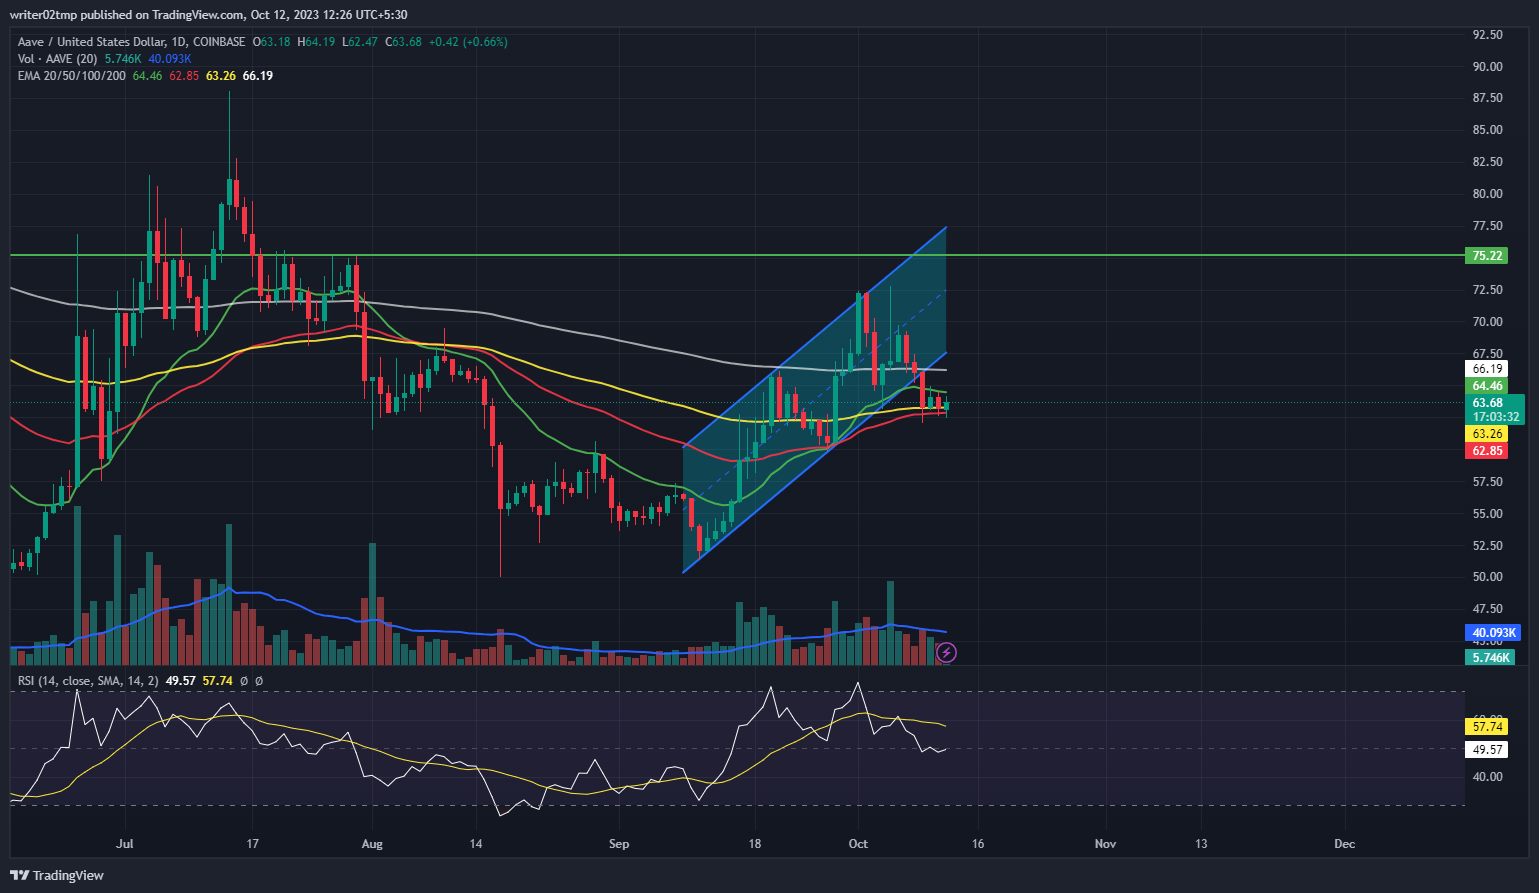
Aave price prediction highlights the slippage of AAVE below the ascending parallel channel pattern. AAVE crypto is trying to enter an upside trend but struggles instead. However, volume change can be seen below average and needs to grow during the intraday trading session. Meanwhile, AAVE crypto is trying to sustain at 50 and 100-days DMAs to recover towards 20 and 200-days daily moving averages.
AAVE crypto price declined by 4.36% in a week but managed to gain around 22.43% in a month. However, AAVE slipped around 19.47% in the last three months; and 22.82% in the last six months. Nevertheless, AAVE crypto price gained around 22.95% year to date.
Technical indicators suggest the sideways momentum of AAVE crypto after slipping from the rising parallel channel. Relative strength index (RSI) highlights the consolidation phase. RSI was at 49 and was struggling to leave neutrality. Investors in AAVE cryptocurrency need to wait for any directional change over the daily time frame chart.
Summary
Aave price prediction indicates the sideways momentum of AAVE crypto below the rising pattern over the daily time frame chart. However, volume change can be seen below average and needs to grow during the intraday trading session. Nevertheless, AAVE crypto price gained around 22.95% year to date. Technical indicators suggest AAVE crypto is in sideways momentum after slipping from the rising parallel channel. Investors in AAVE cryptocurrency need to wait for any directional change over the daily time frame chart.
Technical Levels
Support Levels: $62.15 and $60.53
Resistance Levels: $66.10 and $69.00
Disclaimer
The views and opinions stated by the author, or any people named in this article, are for informational purposes only, and they do not establish financial, investment, or other advice. Investing in or trading crypto or stock comes with a risk of financial loss.
Mr. Pratik chadhokar is an Indian Forex, Cryptocurrencies and Financial Market Advisor and analyst with a background in IT and Financial market Strategist. He specialises in market strategies and technical analysis and has spent over a year as a financial markets contributor and observer. He possesses strong technical analytical skills and is well known for his entertaining and informative analysis of the Financial markets.


